
FIGURE 2.
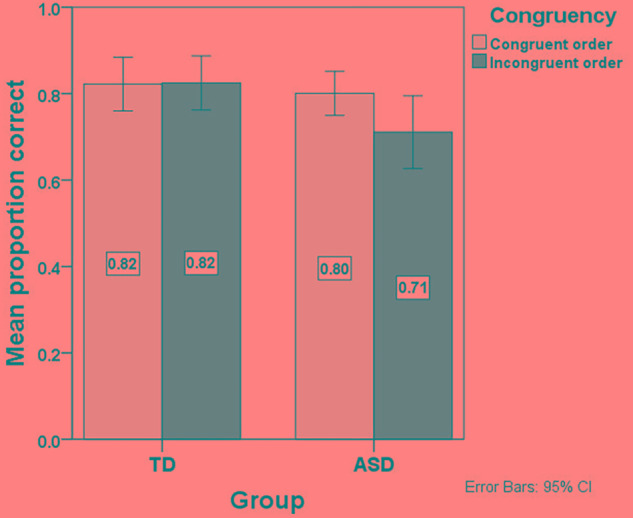
Mean proportion of correct responses in the language comprehension task per Congruency condition (Congruent vs. Incongruent) and Group (TD vs. ASD).
Official websites use .gov
A
.gov website belongs to an official
government organization in the United States.
Secure .gov websites use HTTPS
A lock (
) or https:// means you've safely
connected to the .gov website. Share sensitive
information only on official, secure websites.
Mean proportion of correct responses in the language comprehension task per Congruency condition (Congruent vs. Incongruent) and Group (TD vs. ASD).