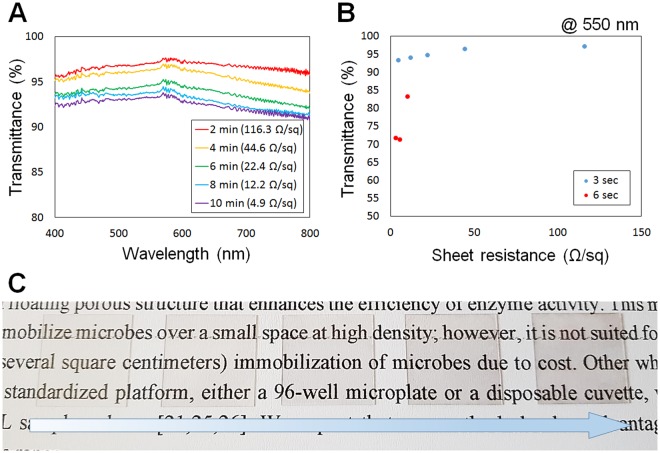
Figure 3.
Correlation between sheet resistance after electroless deposition and conductivity of fabricated transparent electrodes. (A) Graph of the correlation between transmittance and sheet resistance (in the visible range: 400–800 nm). (B) Graph showing the correlation between sheet resistance and transmittance at a wavelength of 550 nm. The blue dot and the red dot indicate the nanofiber collection time adjusted to 3 s and 6 s, respectively. (C) Transparent electrodes fabricated using deposition times of 2, 4, 6, 8, and 10 min, respectively.

