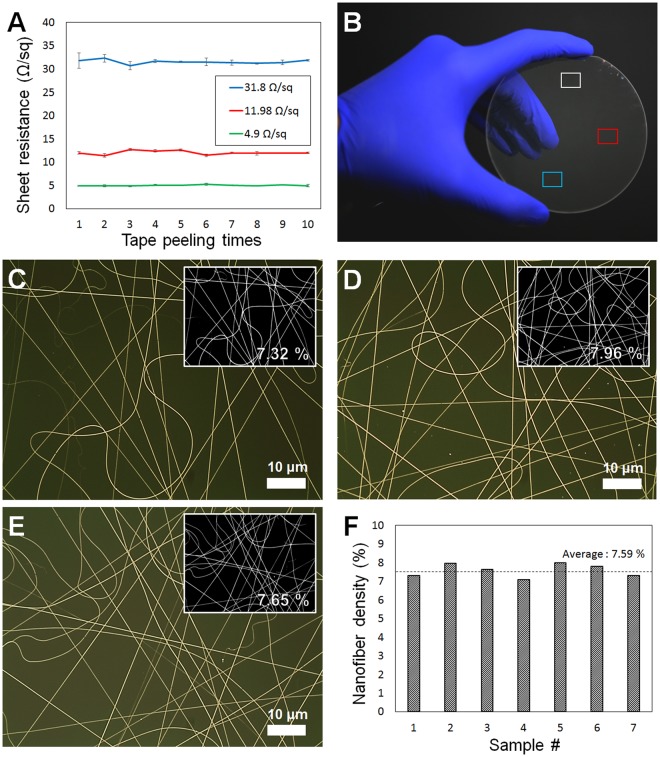
Figure 4.
Mechanical stability test results of transparent electrodes and electrodes evenly formed on a 4-inch glass wafer. (A) Commercial 3 M Scotch Tape was placed in direct contact with the electrode, repeatedly removed and reapplied, and the change in sheet resistance measured (n = 5, mean ± standard error). The electrode formed evenly over the 4-inch glass wafer (B); each part was observed with an optical microscope (C–E). The small inset numbers and pictures for (C–E) are the ratio of the area occupied by the nanowire in the total area and the black/white image. (F) A graph showing the nanowire density calculations for seven randomly selected areas in 4-inch glass wafer.

