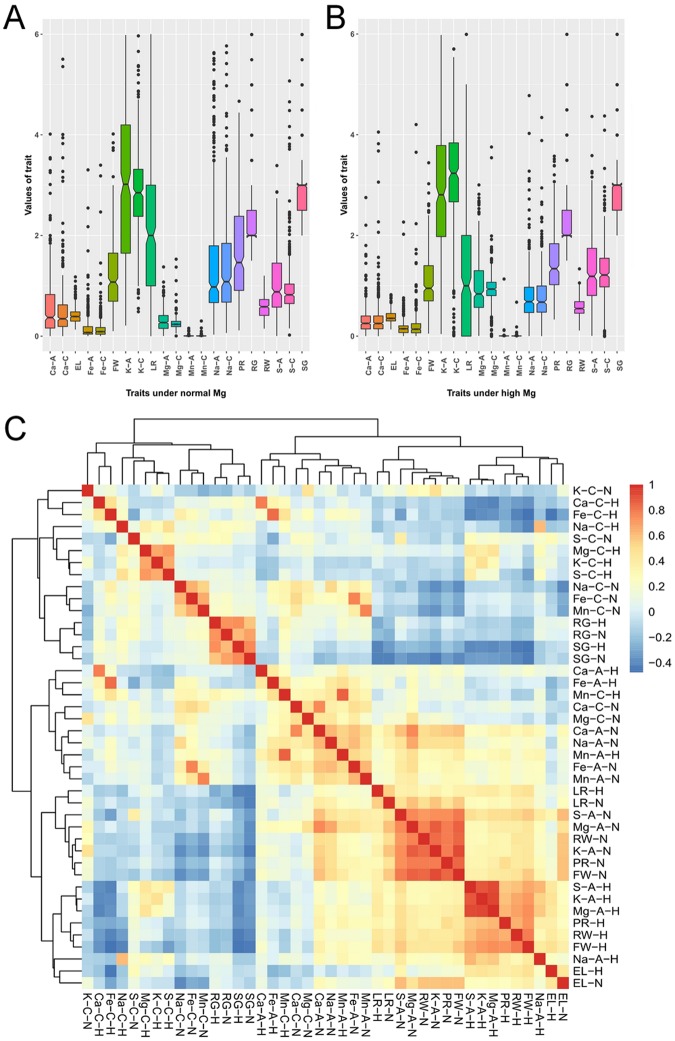
Figure 2.
Natural variation in traits of Arabidopsis accessions grown at normal (1,000 µM) (A) and high Mg2+ (10,000 µM). (B) The average value per accession was calculated, and values of individual traits were plotted using the ‘ggplot2’ package in R. Accessions representing outliers for a trait are indicated by closed circles. (C) Heat map represents cluster of the pearson correlation coefficient between each pair of 42 phenotypes, the pearson’s correlation coefficients were normalized (z-score) and represented with blue-red color scheme.

