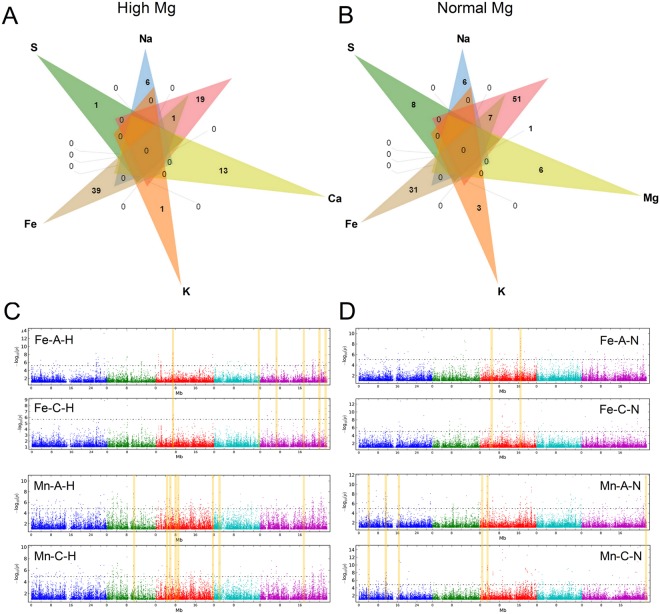
Figure 4.
Venn diagrams representing differentially nutrient (including absorption and concentration) GWAS hits was defined as the one had −log10(p) > 6.15 in high Mg2+ (A) and normal Mg2+ (B) of Arabidopsis. Each list in the venn diagram denotes by a transparent shape and overlaps shape indicates elements shared between lists or more often the corresponding counts. Four lists of input data of Fe-A, Fe-C, Mn-A and Mn-C were highlighted for both high Mg2+ and normal Mg2+ in green, blue, pink and yellow, respectively. Genome-wide association mapping results for the absorption and concentration of Fe and Mn in Arabidopsis under high Mg2+ (C) and normal Mg2+. (D) The ‘Manhattan setting’ plate for customized chromosome color, fixed pixel size, or dynamic pixel size proportional to p-values in Manhattan plot. The 5 chromosomes are represented by different shades of gray with the x-axis as the physical position. The highlighted positions represent the physical positions of the regions sharing common SNP between absorption and concentration of Fe and Mn.

