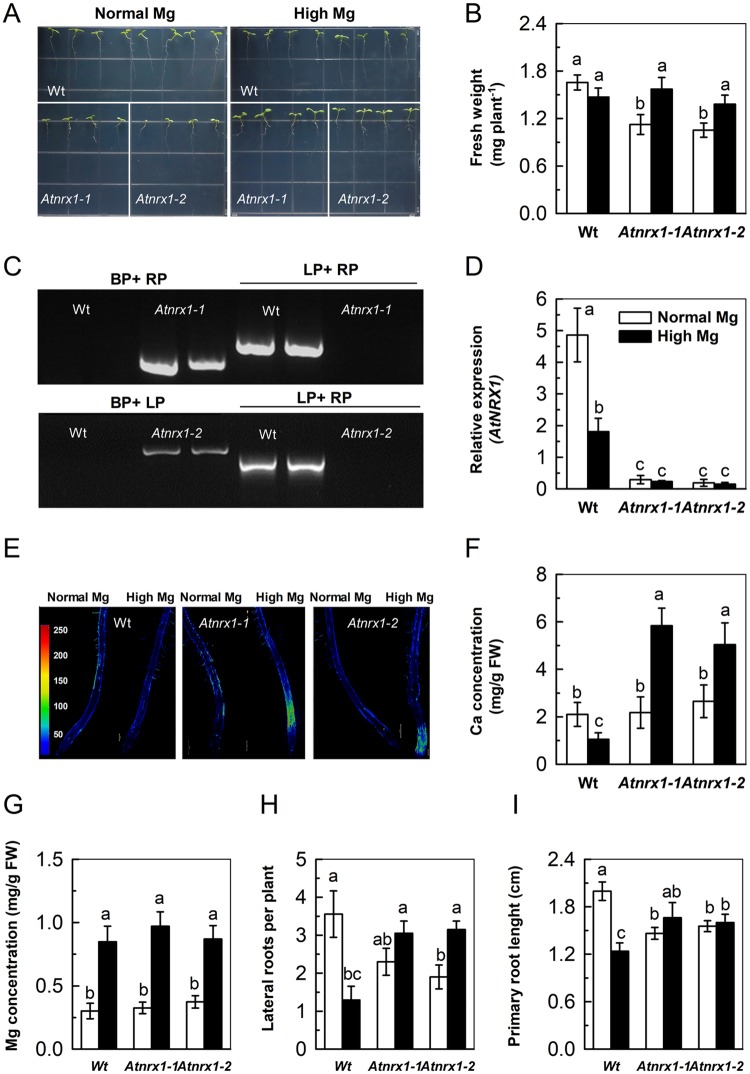
Figure 6.
Validation and physiological phenotypes of Atnrx1 mutant. Image of mutant Atnrx1-1 and Atnrx1-2 and wild plants in media with normal or high Mg2+ (A); results of T-DNA insertion mutant Atnrx1-1 and Atnrx1-2 by PCR with gene-specific primers LP, RP and LB (B); relative expression levels (C); fresh weight (D); confocal images of cytosolic Ca2+ concentration distribution (Fluo-4/AM imaging) during the initiation and tip growth of root hairs (E); concentrations of Ca (F); concentrations of Mg2+ (G); number of lateral root per plant (H) and the length of primary root (I) of wild-type and Atnrx1 mutant (8-day-old seedlings) grown at supply of normal (1,000 µM) and high Mg2+ (10,000 µM). Levels of cytosolic Ca2+ concentration have been color-coded according to the inset scale (Quantitative values under the scale in nM). Bar = 200 μm applies to all photographs in D. The images are representative of at least three independent experiments. Data are means ± SD (n = 5). Means followed by a common letter within a root segment are not significantly different at P < 0.05. FW, fresh weight.

