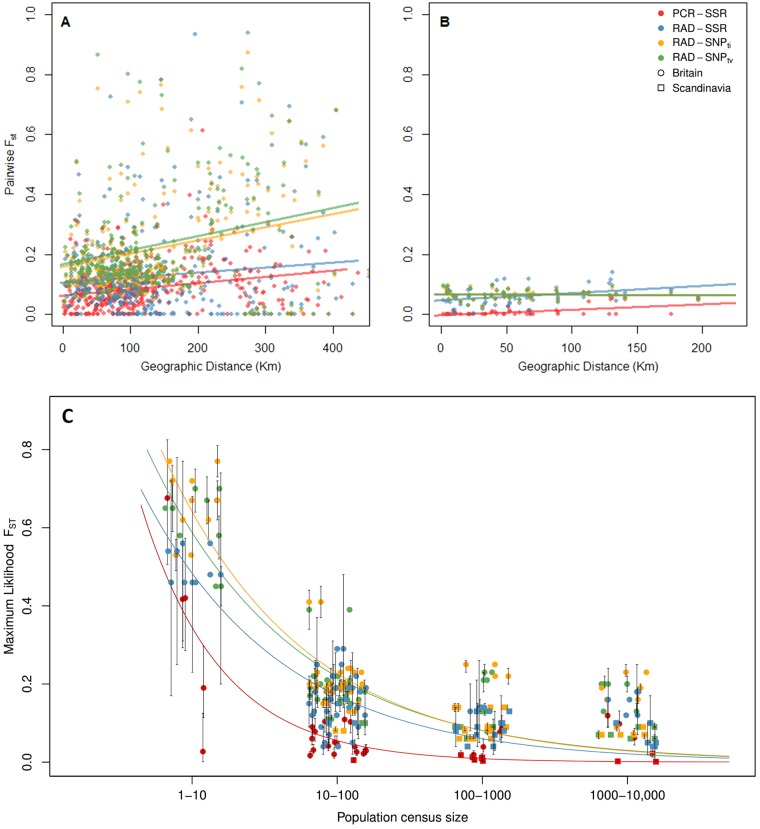
Fig. 4.
a, b Scatter plot of linearized pairwise FST vs. pairwise geographic distance for all study populations for Britain (a) and Scandinavia (b). Weak isolation by distance (p < 0.05) was detected in Britain and Scandinavian populations using PCR-SSRs. All other relationships were non-significant. c Plot of census population size estimates and maximum likelihood FST, for each marker type, using all datasets across both regions. Noise has been added to each of the four x-axis categories to facilitate visualization

