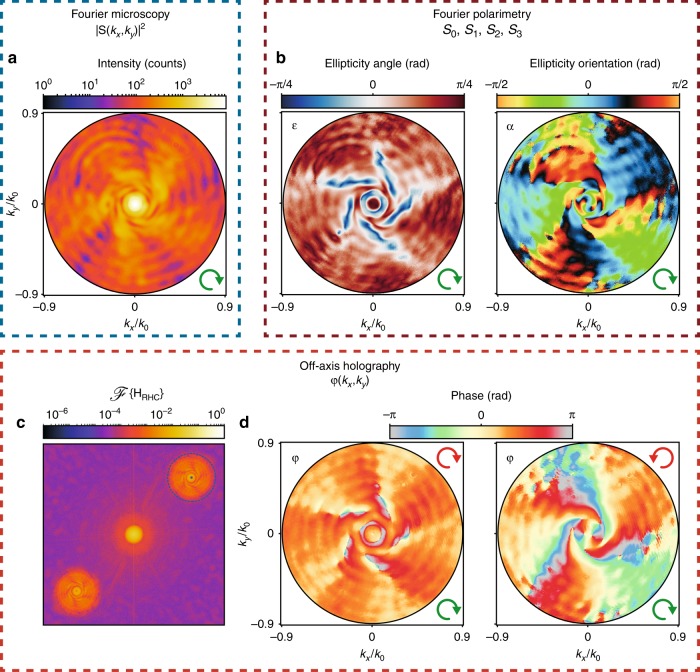
Fig. 3. Demonstrations of Fourier microscopy, polarimetry, and holography.
a Fourier map of intensity, b polarization ellipse parameters and α, c digital Fourier transform of an interferogram obtained with RHC polarized detection, d reconstructed phase profiles for RHC- and LHC-polarized detection. In all sub-figures, RHC polarized input and a m = −5 spiral nanostructure were used. The green and red arrows indicate the input and output polarizations, respectively

