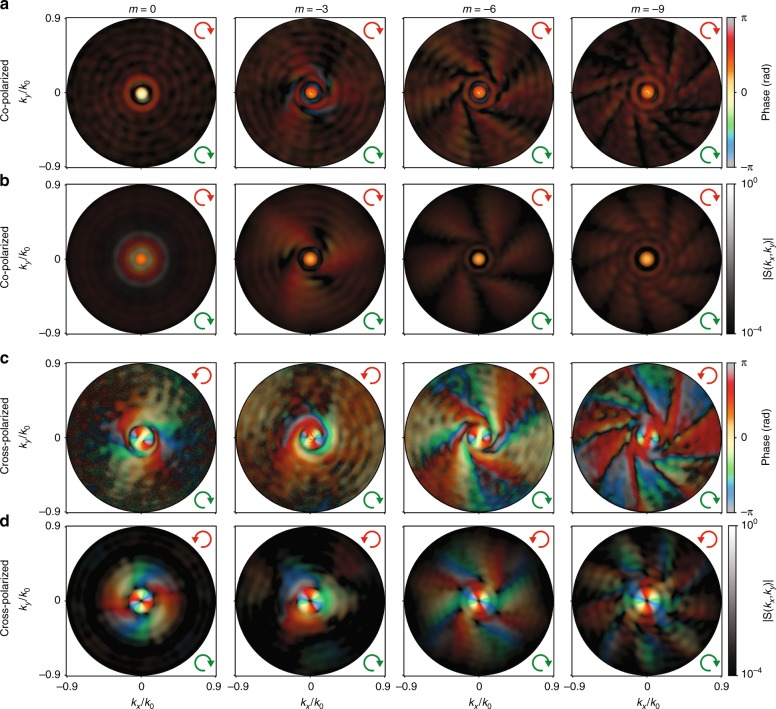
Fig. 4. Example set of interferometric and polarimetric k-space microscopy measurement and simulation results.
a, c Measured and b, d simulated complex field profiles in the Fourier plane of a bullseye (m = 0) and m = −3, −6, −9 spirals. The transmitted polarization channels are co-polarized (a, b) and cross-polarized (c, d) with RHC-polarized input. The plots show a combined representation for the phase as hue and field amplitude as brightness (logarithmic scale). The green and red arrows indicate the input and output polarizations, respectively. Each amplitude profile is normalized by its maximum. A circular representation of the color map used here is given in Fig. S3 c

