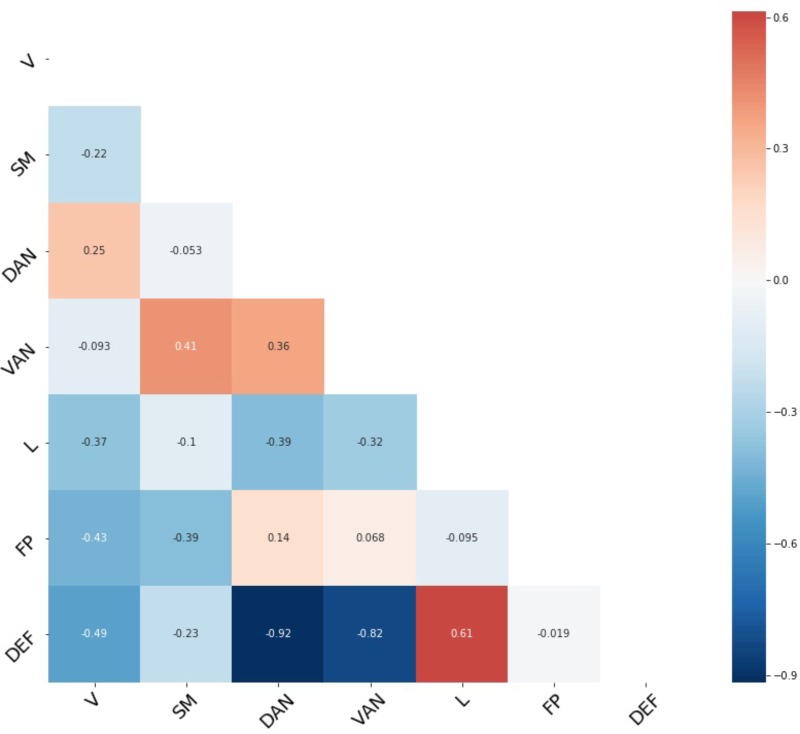
FIGURE 1.
Average network connectivity. Fisher’s z-transformation of Pearson’s correlation between each pair of seven functional networks. V, visual network; SM, sensory/somatomotor network; DAN, dorsal attention network; VAN, ventral attention network; FP, frontoparietal network; DEF, default network.

