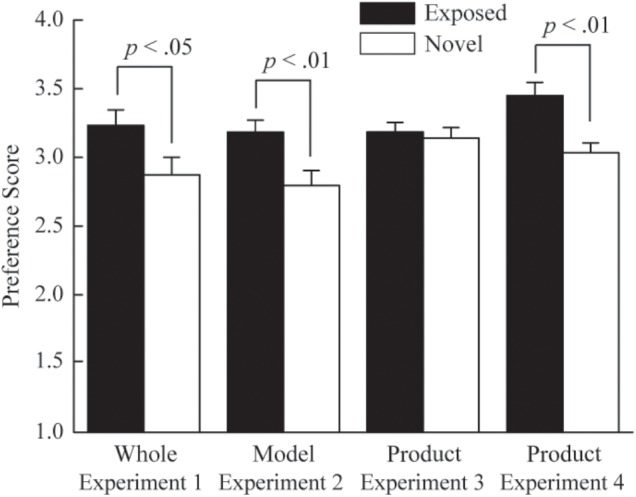
FIGURE 2.

Mean preference scores in Experiments 1–4 (Error bars are MSE). The black and white bars indicate the results in the exposed and novel conditions, respectively. The labels of the x-axis denote the experiment number and objects that were evaluated.
