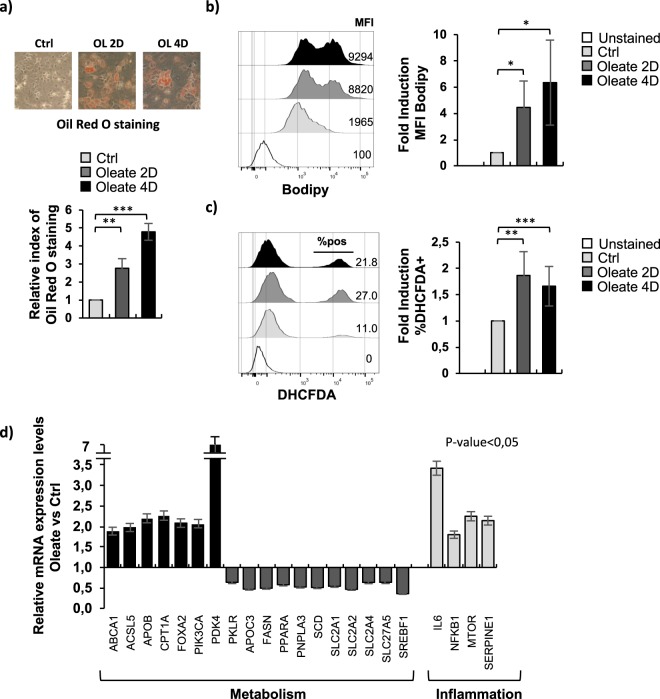
Figure 1.
Sodium oleate treatment of dHepaRG cells induced lipid droplets accumulation, ROS formation and deregulated lipid metabolism and liver-specific genes expression. (a) Differentiated HepaRG (dHepaRG) cells were treated with vehicle (control) or with sodium oleate 250 μM for 2 or 4 days. After treatments, cells were stained with Oil Red O, lipid droplets are visible in red (Upper panels). Oil Red O dye was eluted and OD measured at 500 nm. Results are expressed as fold change of treated cells over control (Lower panel). (b) dHepaRG cells treated as in (a) were analyzed by citofluorimetry after Bodipy staining. Left panel: representative overlay of profile. Right panel: Histograms show MFI (Mean Fluorescence Intensity) as fold induction of treated cells over control from 3 independent experiments. (c) dHepaRG cells treated as in (a) were analyzed by citofluorimetry after DHCFDA (2′,7′-dichlorodihydrofluorescein diacetate) dye staining. Left panel: representative overlay of profile. Right panel: Histograms show % of DHCFDA positive cells as fold induction of treated cells over control from 3 independent experiments. (d) dHepaRG cells were treated as in (a) for 4 days. cDNAs were analyzed with a Human Fatty Liver RT² Profiler PCR Array, histograms show expression levels of a selected panel of genes as fold induction of treated cells over control. (Bars indicate S.D.; asterisks indicate p-value).

