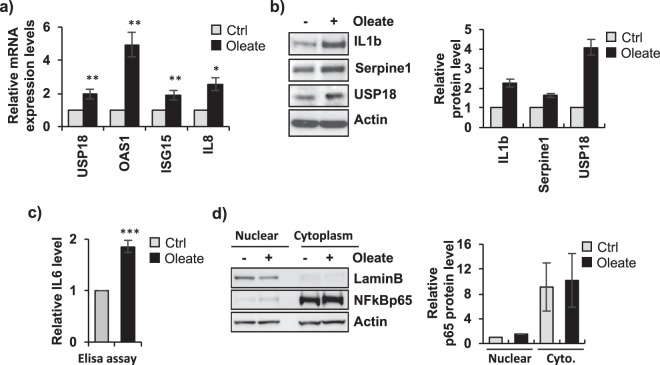
Figure 2.
Fatty dHepaRG cells activate a cell autonomous IL6 inflammatory response. (a) dHepaRG cells were treated with vehicle (Ctrl) or with sodium oleate 250 μM for 4 days. cDNAs were analyzed by qPCR with primers specific for the indicated genes and normalized to Actin. (b) Left panel: total protein extracts were analyzed by Immunoblotting with the indicated antibodies. Right panel: densitometric analysis (ImageJ software). (c) Cells were treated as in a) and supernatants were colllected to quantify secreted IL6 levels by ELISA assay. (d) Left panel: nuclear and cytoplasmic protein extracts from cells treated as in a) were analysed by Immunoblotting with the indicated antibodies. Right panel: densitometric analysis (ImageJ software). Histograms show fold induction of treated cells versus control; bars indicate S.D.; asterisks indicate p-value. Full-length blots are included in Supplementary Fig. 9.

