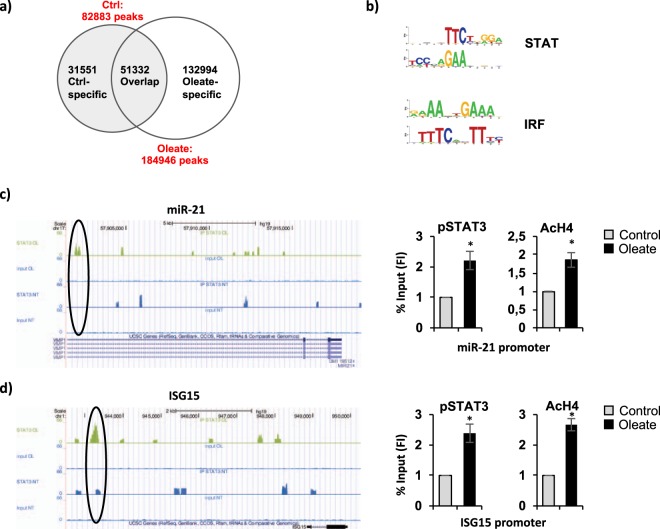
Figure 4.
Identification of phospho-STAT3 binding sites in fatty dHepaRG by ChIP-seq analysis. dHepaRG cells were treated with sodium oleate 250 μM for 4 days (Oleate) or vehicle treated (Ctrl) and immunoprecipitated with a phospho-Tyr705-STAT3 specific antibody. (a) Candidate phospho-STAT3 binding sites from MACS2 peak calling (default MACS2 parameters, qvalue < 0.01). (b) Motif enrichment analysis: STAT (signal transducer and activator of transcription), IRF (interferon-regulatory factor). (c/d) Chip-seq profile (left panels) showing phospho-STAT3 enrichment (black circles) on miR-21 (c) and ISG15 (d) promoters after sodium oleate 250 μM treatment. Right panels: cross-linked chromatin from dHepaRG cells treated as in (a) was immunoprecipitated with a phosphoTyr705-STAT3 (pSTAT3) and an acetylated-Histone4 (AcH4) antibody and analyzed by qPCR with primers specific for the observated phospho-STAT3 peaks on miR-21 (c) and ISG15 (d) promoters, identified by chipseq analysis as shown in left panels. Histograms show Fold Induction (FI) of the % of Input (mean from 3 independent experiments; bars indicate S.D.; asterisks indicate p-value).

