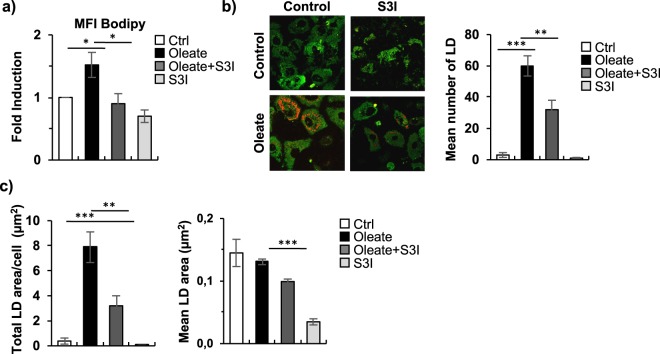
Figure 6.
STAT3 inhibition reduced dHepaRG sodium oleate-dependent lipid accumulation. (a) FACS analysis of dHepaRG cells treated as in Fig. 5(a) and stained with the Bodipy lipid probe. Histograms show fold change of treated samples over controls of Mean Bodipy Fluorescent Intensity (MFI). (b) CARS analysis of dHepaRG cells treated as in Fig. 5(a). Left panels: representative images showing lipid droplets fluorescence in red. Right panel: histogram shows mean number of LD, bars show S.E. (c) CARS analysis of dHepaRG cells treated as in Fig. 5(a), histograms show total droplet area/cell (left) and mean droplet area (right). (Bars indicate S.E.; asterisks indicate p-value).

