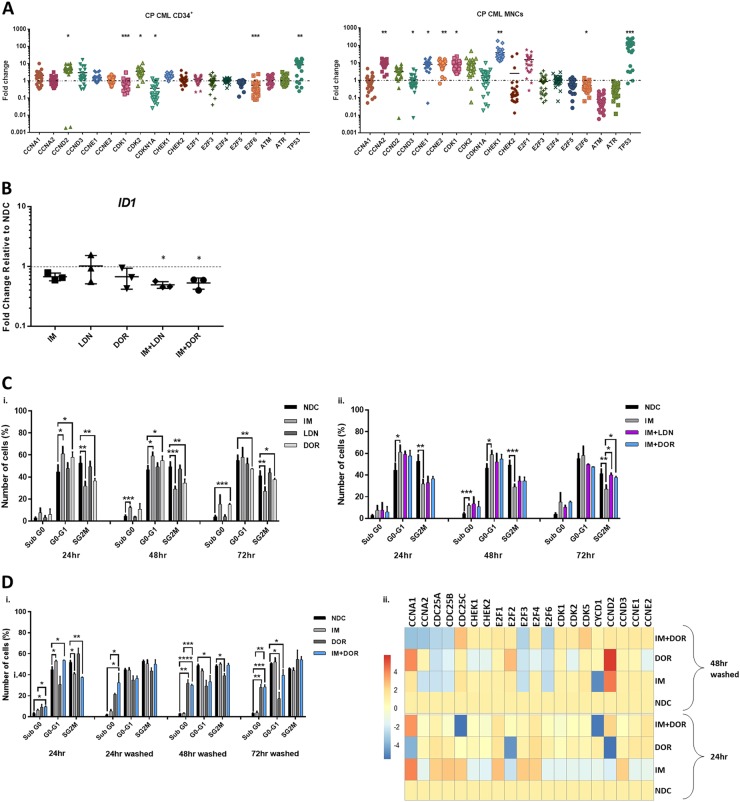
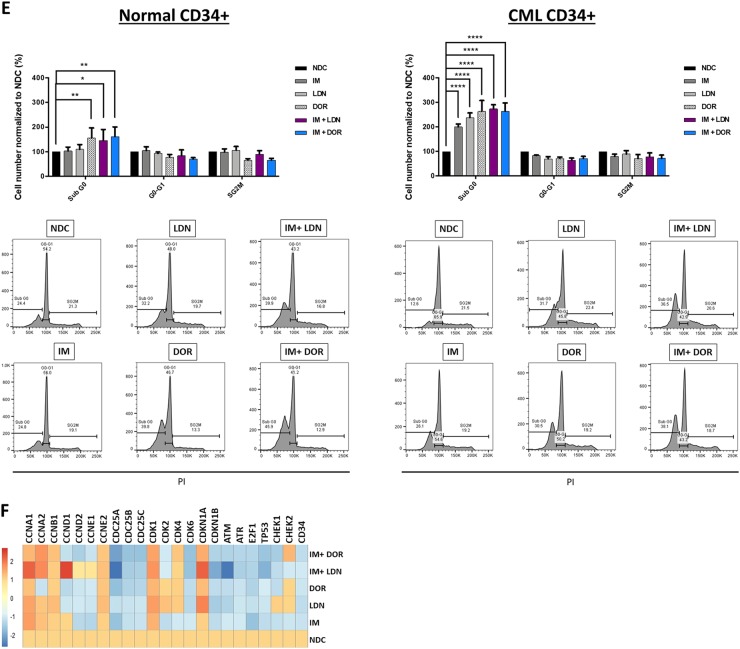
Fig. 3. The effect of IM and BMP inhibitors on cell cycle progression and cell cycle gene expression pattern.
a Cell cycle pathway gene expression of 60 patients enrolled in the SPIRIT2 clinical trial. Genes were analysed in 30 CP-CML CD34+ samples and 30 MNC CP-CML samples using the Fluidigm Biomark system. Four normal CD34+ BM samples, two peripheral blood CD34+ normal donor samples and four normal MNC samples were used as comparators. Statistical analysis was performed using Welch’s test. b The expression level of ID was assessed in CD34+ cells treated with IM, BMP inhibitors and the combination. Dual inhibition with both BMP inhibitors and IM decreased the expression of ID in all patient samples tested, compared to single-agent treatments. Statistical analysis was performed using Student’s paired t-test. *p < 0.05–0.01. c Propodium iodide (PI) analysis of cell cycle progression in K562 cells treated with IM, BMP inhibitors and the combination of both (IM = 500 nM, LDN = 500 nM, DOR = 2.5 μM, n = 4) after 72 h. i Treatment with individual inhibitors arrested cells in G1, with DOR causing more cell cycle arrest than LDN or IM. ii There is a further increase in the number of cells present in G1 phase when DOR was used in combination with IM (n = 4). d-i PI analysis of K562 cell cycle treated with IM, BMP inhibitors and the combination (IM = 500 nM, LDN = 500 nM, DOR = 2.5 μM, n = 3) when cells are washed to remove drugs 24 h post treatment. IM arrests K562 cells in G0-G1 at 24 h; however, cells go back into cycle after drug withdrawal. A different pattern was observed with DOR in combination with IM, where cells remained out of cycle after drug removal with a significant increase in the number of cells present in sub-G1. ii Expression analysis of cell cycle genes 48 h after drug wash-out, n = 3. e Cell cycle analysis of normal and CP-CML CD34+ samples treated with IM, BMP inhibitors and the combination of both (IM = 1 µM, LDN = 1 µM, DOR = 2.5 μM) at 72 h. Data show a significant increase in the number of cells in Sub-G0 in all single and dual treatments of normal and to a higher extent for CML samples (n = 3) (f) Analysis of cell cycle genes in CD34+ CP-CML cells in response to treatments (IM = 1 µM, LDN = 1 µM, DOR = 2.5 μM, n = 4). Cell cycle PI data are expressed as mean ± standard deviation and were compared using the unpaired Student’s t-test (c, d) or ANOVA (e). ****p < 0.0001, ***p < 0.001–0.0001, **p < 0.01–0.001, *p < 0.05–0.01


