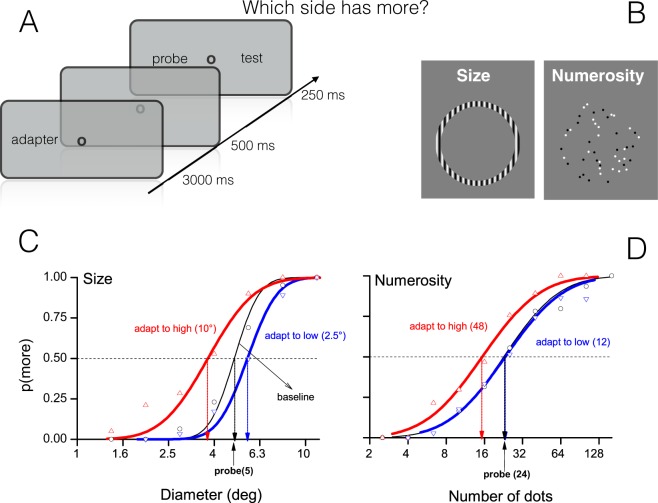
Figure 1.
Methods and aggregate psychometric functions. (A) Each trial started with a central fixation point followed by the adaptation phase in which the adapting stimulus was displayed on the left of the screen. During this phase, participants fixated the central spot and pressed the space bar when s/he saw it flashing (1/3 of the trials). After this phase a blank pause of 500 ms preceded the test phase in which two stimuli were simultaneously presented for 250 ms on the left and on the right of the central spot. Participants indicated which of the two was perceived as higher/larger. (B) Example of stimuli used for the size and numerosity perception tasks. (C,D) Psychometric curves for the three adaptation levels: baseline (black), adaptation to “low” (half-numerosity or half-size of probe: blue) and adaptation to high (twice probe: red). The curves are generally separated from each other, showing that adaptation occurred. Leftward shifts indicate probe underestimation, rightward overestimation. Vertical arrows point to PSEs values.

