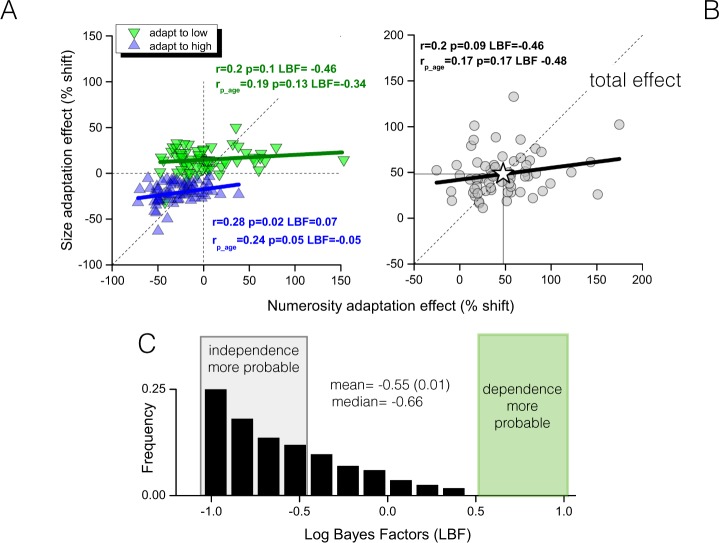
Figure 3.
Correlations between adaptation effects. Size against numerosity adaptation effects (A) separated into the two adaptation levels (inverted green triangles and upright blue triangles for adaptation to low and high adapters) and (B) for total effect. In all cases those participants (single symbols) having higher size adaptation are not those also showing stronger numerosity adaptation. (C) Overall frequency distribution of Log Bayes Factors measured for zero-order correlations reveals that is much more probable that the correlation does not exists (LBF < 0.5). Lines are best fitting linear regression fits, “r” reports Pearson zero-order correlation coefficients, “rp” reports Pearson partial correlation with chronological age controlled for, LBF are Log Bayes factors.

