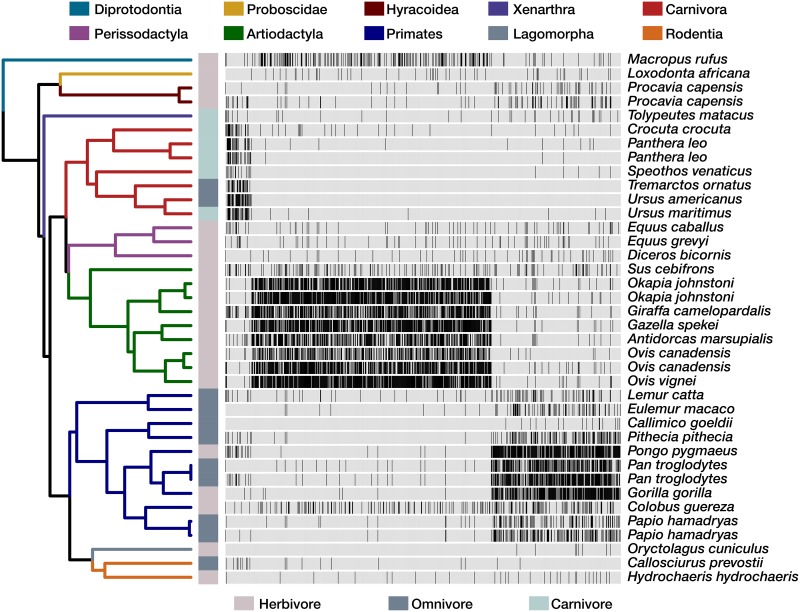
FIG 2 .
The phylogenetic distribution of conserved bacterial clades reveals associations between gut microbiota and mammalian evolutionary history. The 865 clades that are conserved in at least one mammalian order (q value < 0.2) and are not associated with dietary strategy are plotted as columns in a heat map that illustrates their occurrence across mammalian lineages as black ticks. This includes 38 clades that are conserved across the mammals considered in this study. The dendrogram illustrates the evolutionary relationships among mammals, where edges are colored by order and dietary strategy is indicated adjacent to the tips.

