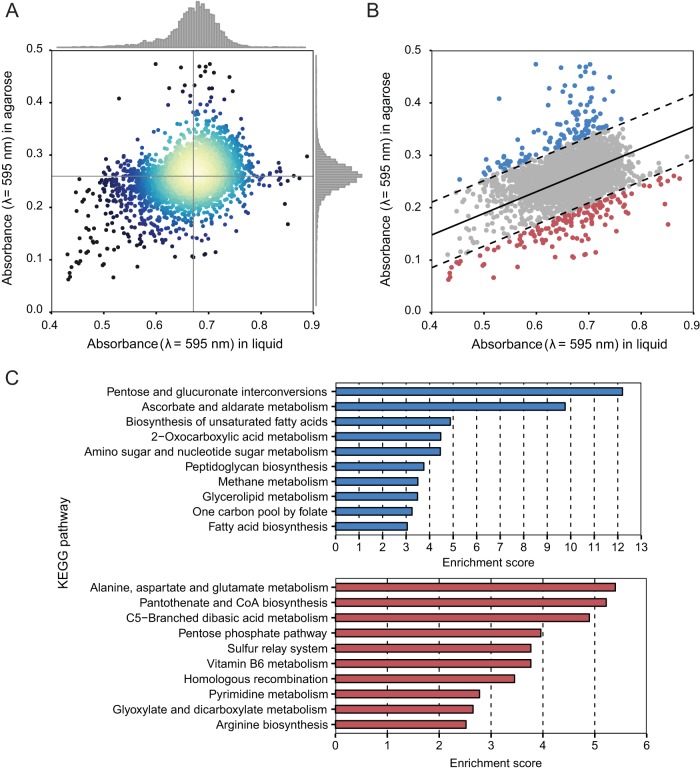
FIG 2 .
Genome-wide stiffness screen of Pseudomonas aeruginosa. (A) A scatter plot of all gene transposon mutants in P. aeruginosa PA14 and corresponding absorbance values (λ = 595 nm) for cell growth in LB and in 1% agarose infused with LB; each point represents a single gene transposon mutant. Regions in the plot with the highest density of data points are depicted in yellow. (B) A plot of genome-wide stiffness screening data fitted using a bivariate normal distribution. Transposon mutants highlighted by blue data points (n = 115 genes) had higher growth in 1% agarose than the mutants highlighted by red data points (n = 133 genes). Genes that lie within the interval between two dashed lines (in gray) followed a linear growth model. (C) A summary of KEGG pathway enrichment for the data depicted in blue (in panel B) with higher cell stiffness and the data depicted in red with lower cell stiffness.

