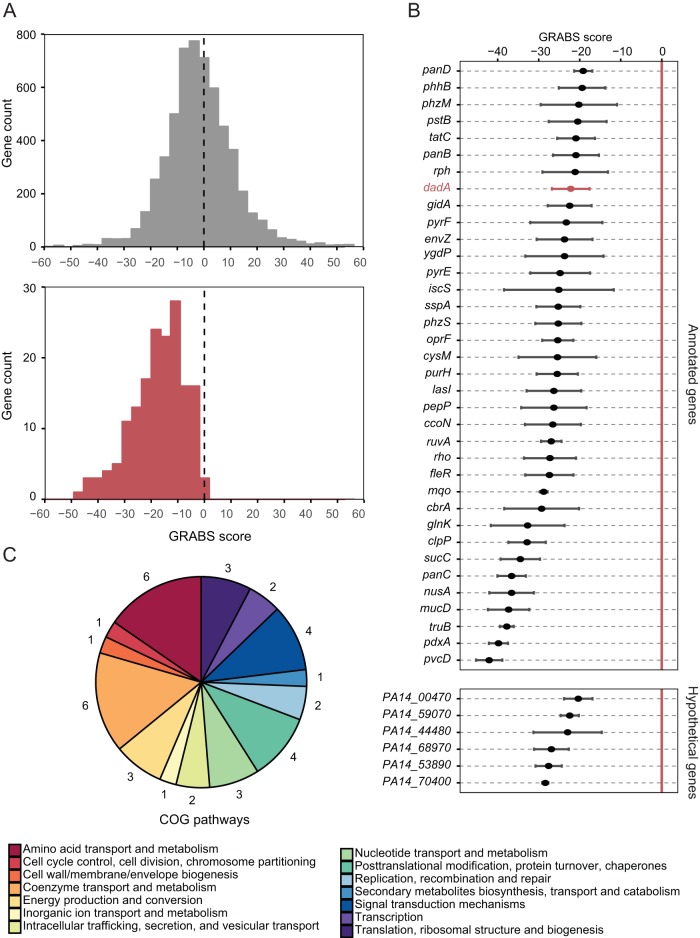
FIG 3 .
Stiffness genes code proteins involved in diverse biochemical pathways. (A) A histogram depicting that the GRABS score distribution of rescreened genes (bottom panel) shows a reduction in the mean GRABS score compared to the genes in the entire screen (top panel). (B) A plot of the GRABS scores along with the corresponding variance for 42 rescreened genes. 36 out of 42 genes were annotated and had an assigned biochemical function. 6 of the top 42 hits are not yet annotated and are named after their respective gene locus. The P. aeruginosa PA14 dadA::Tn mutant (depicted in a red) has very low variance in the GRABS score and consistently produces a negative GRABS score. (C) Gene ontology information (COG, classification of gene ontology) for the top hits. The numbers surrounding the pie chart indicate the number of genes (out of the 42 selected) that are represented within each COGs family.

