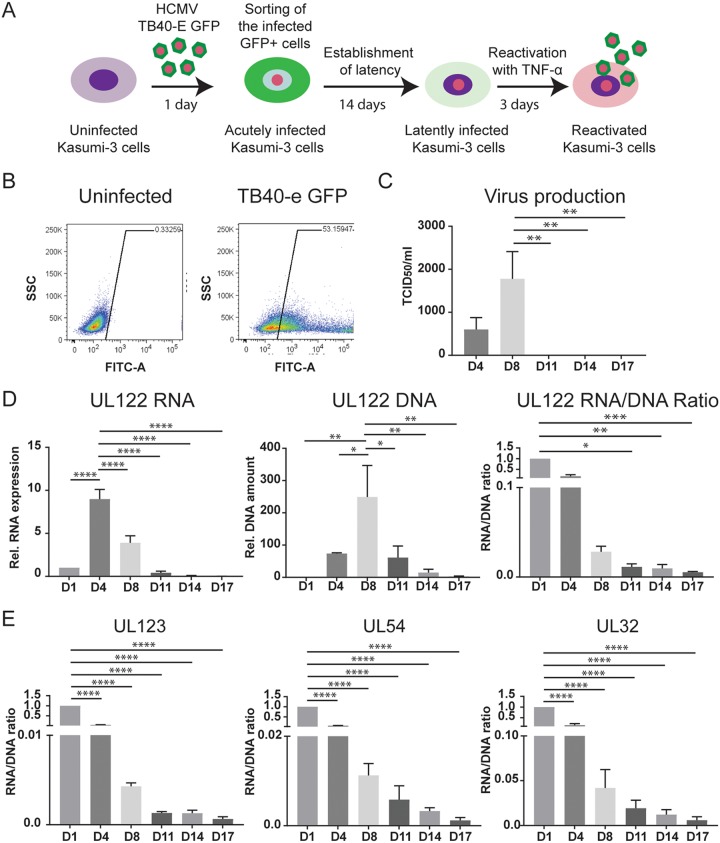
FIG 1 .
HCMV latency is established after activation of transcription at 14 days postinfection. (A) Schematic outlining the infection model used for studies of latency and reactivation in Kasumi-3 cells. GFP+ infected cells were purified by flow cytometry at 1 dpi. On day 14, latently infected cells were treated with TNF-α for 3 days to induce reactivation. (B) Representative FACS analysis of GFP expression in Kasumi-3 infected cells at 1 dpi compared to uninfected cells. FITC, fluorescein isothiocyanate; SSC, side scatter. (C) Release of viral particles into the medium was measured by a TCID50 assay on MRC-5 cells after 2 weeks. (D) UL122 mRNA expression and DNA amount were analyzed at the indicated times postinfection and expressed relative to day 1 after normalization to GAPDH or RNase P. (E) RNA/DNA ratios of UL123, UL54, and UL32 over the course of infection. For panels C to E, statistical significance was calculated by a one-way analysis of variance with Dunnett’s multiple-comparison test (n = 4). The error bars represent standard errors of the means, and the asterisks indicate P values (*, P ≤ 0.05; **, P ≤ 0.01; ***, P ≤ 0.001; ****, P ≤ 0.0001) calculated by the comparison to the peak (day 4 for RNA, day 8 for DNA and virus, and day 1 for the RNA/DNA ratio).

