FIG 2 .
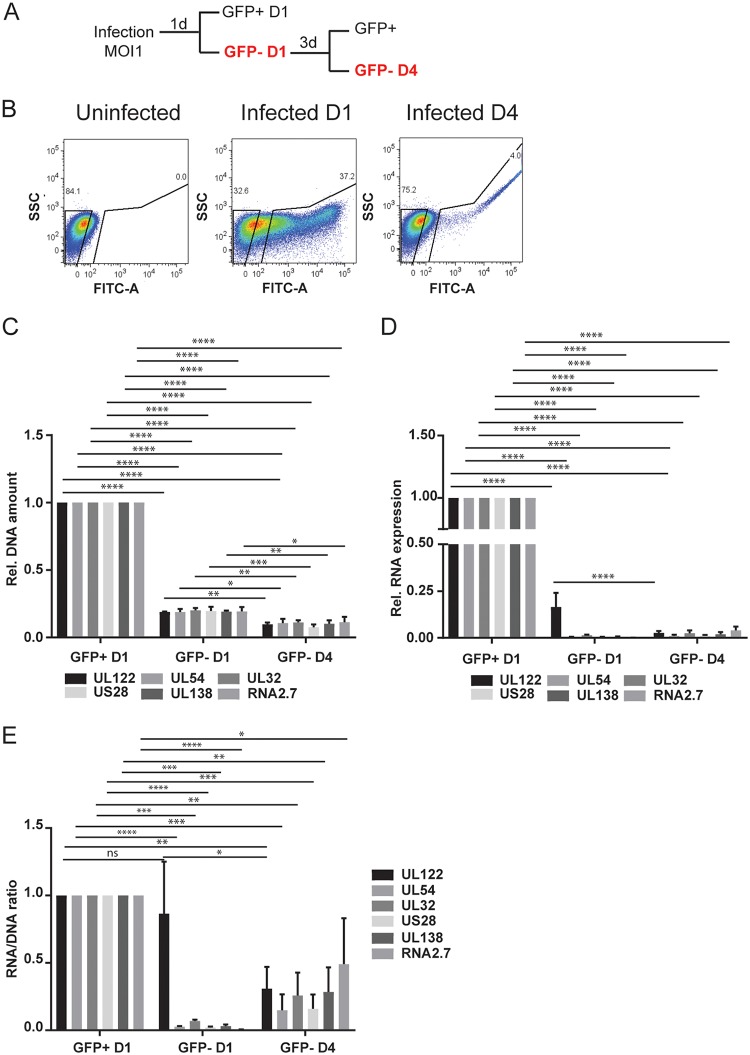
Analysis of GFP− infected cells at 1 and 4 dpi. (A) Schematic outlining the sorting strategy to purify GFP− cells at day 1 and day 4 postinfection. (B) Representative FACS analysis of GFP sorting at day 1 and day 4 postinfection. (C to E) DNA amount (C), mRNA expression (D), and RNA/DNA ratio (E) of UL122, UL54, UL32, US28, UL138, and RNA2.7 analyzed at the indicated times postinfection and expressed relative to day 1. RNA expression values were normalized to GAPDH, and the DNA amount was normalized to RNase P. The statistical significance was calculated by two-way analysis of variance with Tukey’s multiple-comparison test (n = 3). The error bars represent the standard errors of the means, and the asterisks indicate P values (*, P ≤ 0.05; **, P ≤ 0.01; ***, P ≤ 0.001; ****, P ≤ 0.0001) calculated by comparison of the different genes at each time point.

