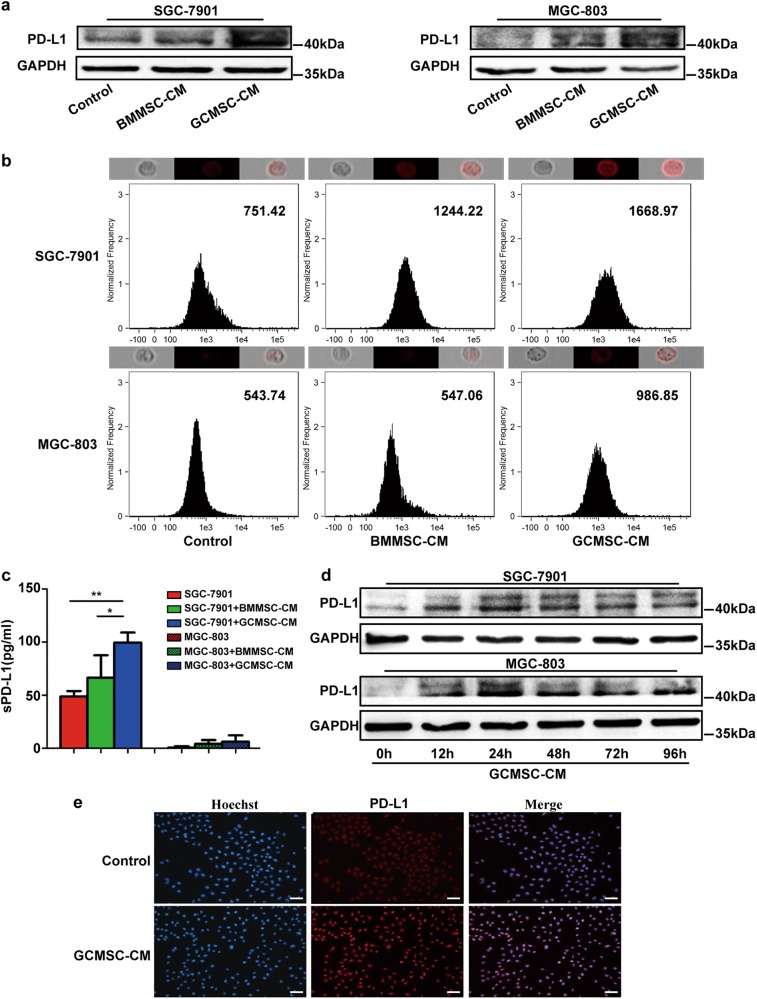
Fig. 2. The expression of PD-L1 in GC cells treated with GCMSC-CM.
The PD-L1 expression of SGC-7901 and MGC-803 treated with BMMSC-CM or GCMSC-CM for 24 h was detected by western blot (a) and flow cytometry (b) (median was shown). Cells expressing different levels of PD-L1 (red fluorescence) were shown above corresponding flow cytometry histograms. c The sPD-L1 levels in culture supernatants of SGC-7901 and MGC-803 treated with BMMSC-CM or GCMSC-CM for 24 h were detected by ELISA. d The PD-L1 expression of SGC-7901 and MGC-803 treated with GCMSC-CM for 12, 24, 48, 72 and 96 h was detected by western blot. e The PD-L1 level of MGC-803 treated with GCMSC-CM for 24 h was evaluated by immunofluorescence. Bar = 50 μm. Data in c represents the mean ± SD of three repeated experiments (n = 3). GCMSCs were isolated from three different GC patients. *P < 0.05, **P < 0.01

