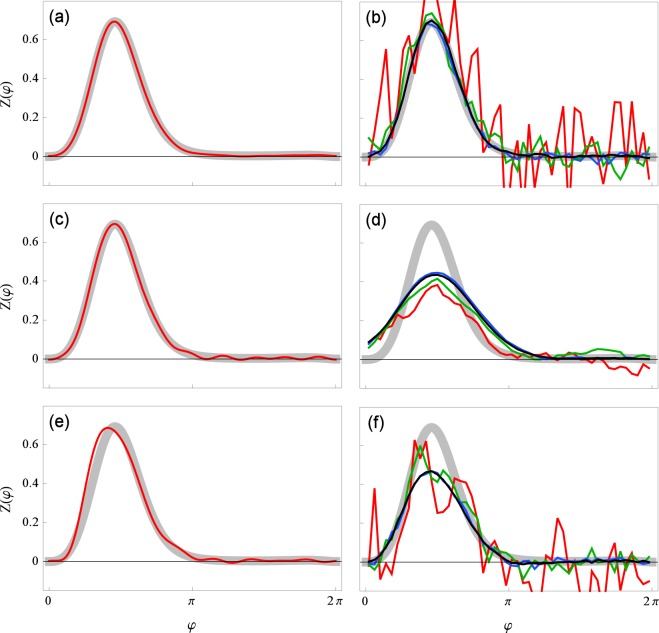
Figure 7.
Comparison of our method (a,c,e) and the WSTA method7,10 (b,d,f). The data was simulated using the phase model (1). Different colors correspond to the length of time series used for the reconstruction: tsim = 102 in red, 103 in green, 104 in blue and 105 in black (for our method (a,c,e) only the tsim = 102 is plotted). The true PRC is depicted with a thick gray curve. In (a,b) the coupling is relatively weak, , and the correlation time of the input is relatively small, τ = 0.01. These are good conditions for both methods, and indeed both perform well. In (c,d) the coupling remains as before but the correlation time is larger, τ = 0.1. In (e,f) the coupling strength is increased, , while the correlation time is small again, τ = 0.01.

