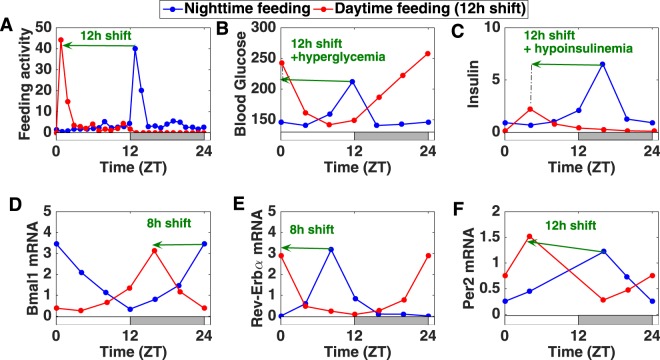
Figure 1.
Effect of restricting food access to the normal rest phase in published experimental data (pancreas, mouse)18,19. (A) Measurement of the feeding activity which corresponds to the number of pellets consumed per hour19. (B,C) Levels of blood glucose and insulin18. (D–F) Pancreatic clock gene expression18. Comparison between the normal feeding (in blue) and the time-restricted feeding (in red) conditions. The alternation of white and grey bars symbolises the LD cycles.

