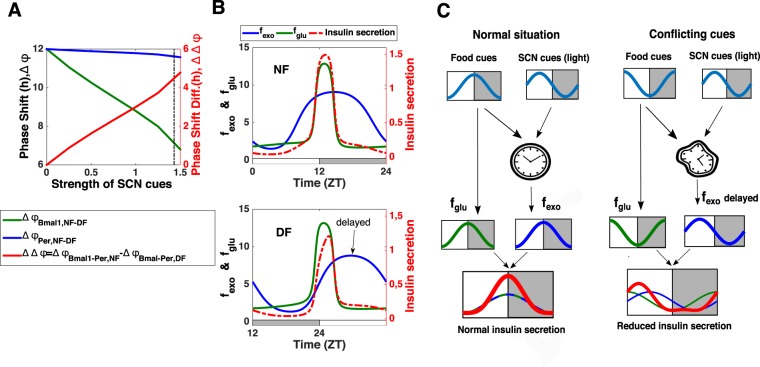
Figure 5.
Mechanism behind the metabolic syndrome: differential phase shift in local clock gene expression due to conflict between nutrient and SCN-driven cues and resulting misalignment between nutrient and clock-controlled cues. (A) Left Y-axis: Effect of a shift from NF to DF as a function of the strength of SCN-driven cues for Per mRNA (phase shift in blue) and Bmal1 (phase shift in green). The strength of the SCN-driven cues corresponds to the value of the parameter cneur (see Supplementary Information) and it is altered by increasing the parameter value from 0 to 1.55. The vertical black dotted line corresponds to the strength of SCN-driven cues used in the rest of the simulations (cneur = 1.4336). Right Y-axis: The phase shift difference between Bmal1 and Per mRNAs (which corresponds to the phase difference Bmal-Per in NF minus the phase difference Bmal-Per in DF) is also represented as a function of the strength of SCN-driven cues (red curve). (B) Upper panel: Insulin secretion (red dotted curve) for nighttime feeding: the high secretion results from an alignment between glucose cues (fglu, green curve) and clock-controlled exocytosis cues (fexo, blue curve). Lower panel: Insulin secretion (red dotted curve) for daytime feeding: the reduced secretion results from a misaligment between glucose cues (fglu, green curve) and clock-controlled exocytosis cues (fexo, blue curve) which are delayed. The quantities fexo and fglu represent the effect on insulin secretion of glucose and clock-controlled exocytosis cues respectively (see Table S2 in Supplementary Information for the exact expressions). The alternation of white and grey bars symbolises the LD cycles. (C) Summary of the mechanism leading to hypoinsulinemia when nutrient and SCN-driven cues are conflicting.

