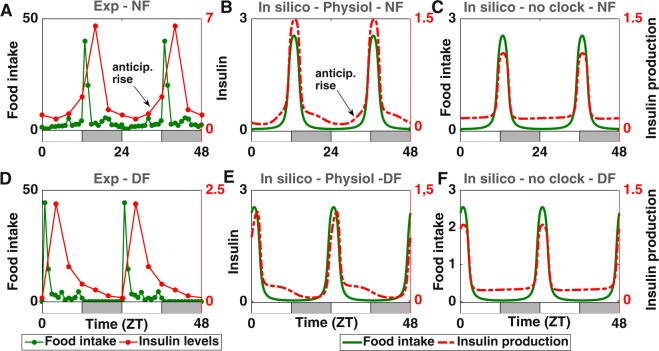
Figure 6.
Loss of anticipation due to misalignment between nutrient and clock-controlled exocytosis cues. (A,D) Comparison of experimental insulin levels (red dots) for nighttime (upper panel, A) and daytime feeding (lower panel, D). (B,E) Comparison of in silico insulin secretion (red dotted curve, B) for nighttime (upper panel, E) and daytime feeding (lower panel). (C,F) Comparison of in silico insulin levels (red dotted curve) for nighttime (upper panel, C) and daytime feeding (lower panel, F) in the absence of any clock. Food intake is represented in green. A food anticipatory insulin rise can only be observed in panels A and B. The alternation of white and grey bars symbolises the LD cycles.

