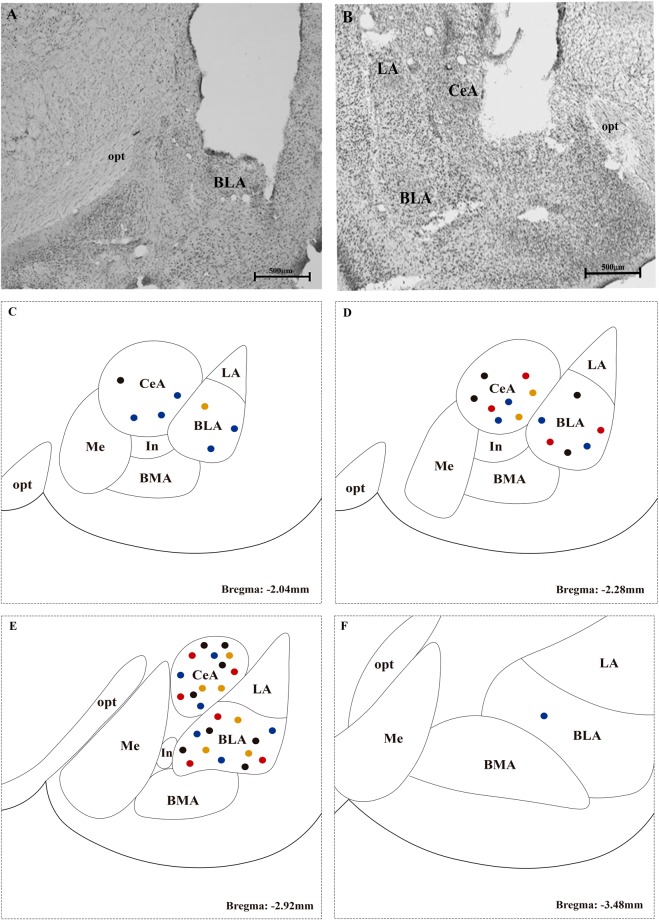
Figure 2.
Representative photomicrographs of sites of injection into the basolateral (BLA) (A) and central (CeA) (B) nuclei of the amygdala. A representation of the microinjections sites along Bregma −2.04 (C), −2.28 (D), −2.92 (E) and −3.48 mm (F) is shown for BLA- and CeA-targeted injections. Each dot indicates the site of injection corresponding to a different group. FOP saline: black dots; FOP muscimol: orange dots; CCI saline: red dots, and CCI muscimol: blue dots. Scale bars represent 500 μm in all photographs. BMA: basomedial nucleus of the amygdala; In: intercalated nucleus of the amygdala; Me: medial nucleus of amygdala; opt: optic tract.

