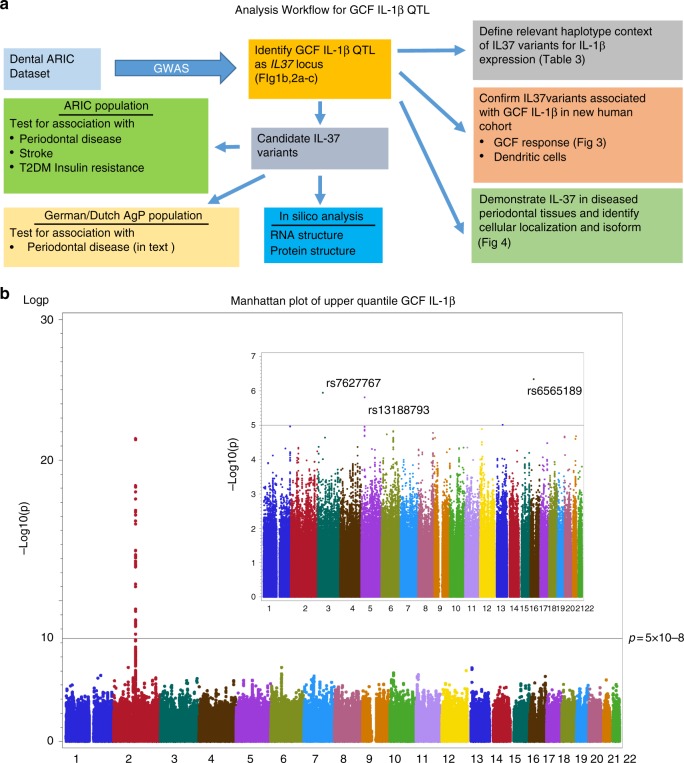
Fig. 1.
Data analysis workflow and Manhattan plot for GCF and serum IL-1β. a Analysis Workflow schema for GCF IL-1β QTL illustrating genomic and phenotype association of GCF-IL1β trait. b Manhattan Plot for Top Quartile of GCF IL-1β, as compared to lower 3 quartiles. All 22 chromosomes are shown, plotting the -log10 (p values) for each of the 656,292 high-quality SNPS using ProbABEL. For GCF-IL-1β the dominant locus emerges in chr2 with no other genomic regions showing SNPs that cross the significance threshold of p = 5 × 10⁻⁸, as shown as a horizontal reference line. The insert panel represents the Manhattan plot for the serum IL-1β for the same subjects. Although no serum IL-1β SNPs reach GWA significance, the top three are identified in chr 3(rs7627767), 5(rs13188793) and 16 (rs6565189)

