
Fig. 2.
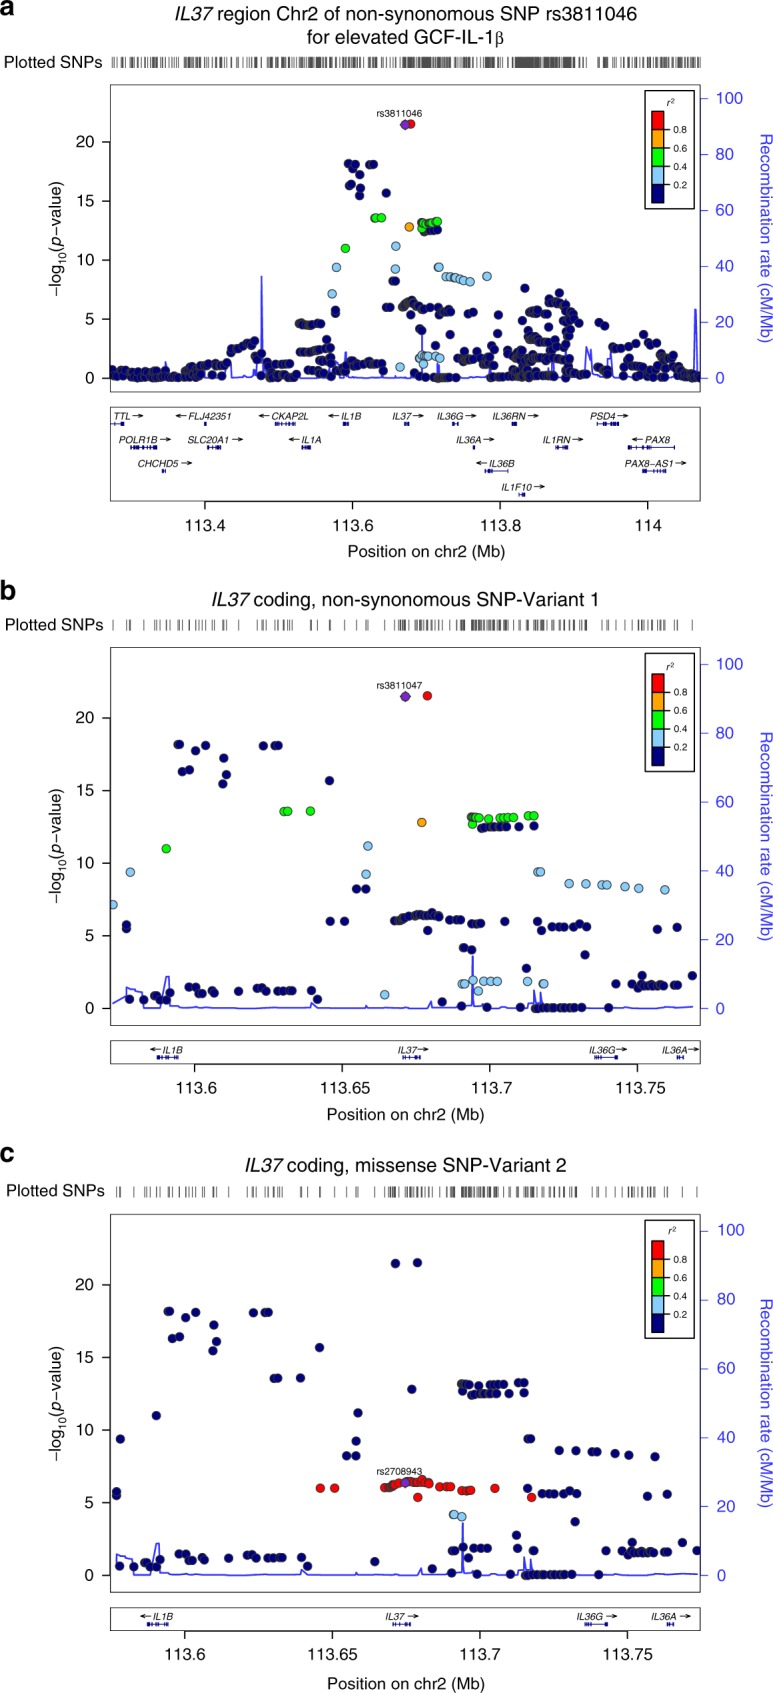
LocusZoom Plot for IL-37 SNPs. The genomic region shown in the Manhattan plot in chr2 is magnified using LocusZoom to illustrate the individual SNPs within the dominant locus for Top Quartile of GCF IL-1β. a LocusZoom Plot shows entire IL-1 gene complex region from IL1A to IL1RN. IL37 (IL1F7, rs3811046, p = 3.3 × 10⁻²²), IL36G (IL1F9, rs11677903, p = 5.4 × 10⁻¹⁴), IL38 (IL1F10, rs1301182, p = 2.4 × 10⁻⁸), IL36A (IL1F6, rs6714534, p = 6.7 × 10⁻⁹) and IL1B (rs16944 p = 6.5 × 10⁻¹⁹). b LocusZoom Plot for IL-37 SNP-Variant 1 highlighting the lead SNP at rs3811047 (missense). c LocusZoom Plot for IL-37 SNP-Variant 2 that shows additional missense SNPS in disequilibrium with rs2708943 as the indexed SNP