Fig. 3.
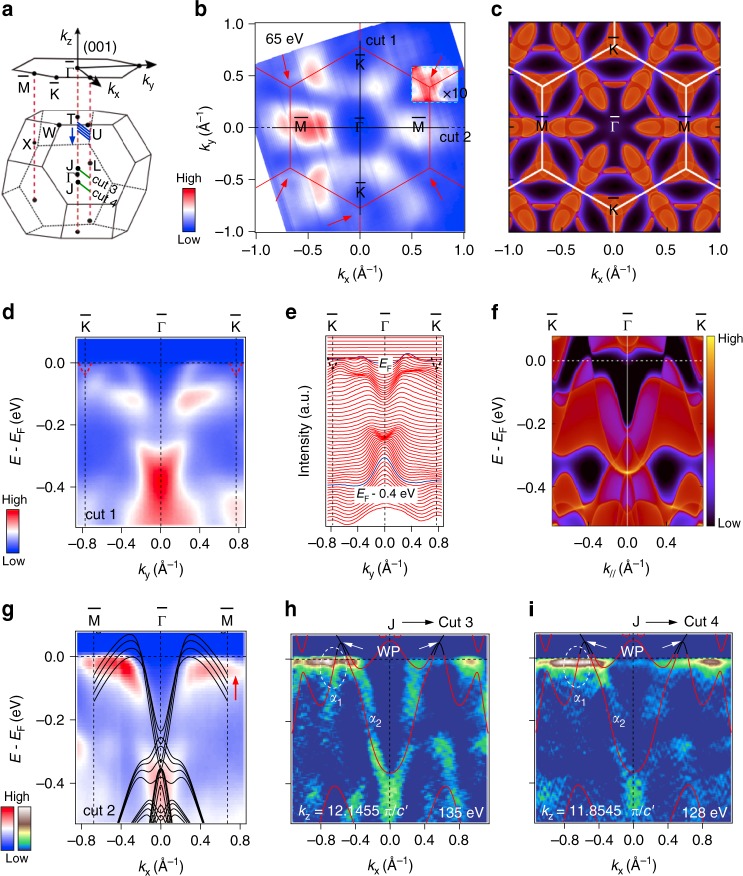
Near-EF ARPES spectra compared with first-principle calculations of Co3Sn2S2. a Schematic primitive BZ and 2D projected BZ of the (001) surface. Blue lines parallel to the direction indicate the momentum locations of calculated band structures in g, with the kz momenta of 0.96, 0.92, 0.88, and 0.84 π from top to bottom, respectively. Cuts 3 and 4 illustrate the momentum locations of the predicted WPs, which are parallel to the direction in the kz = ± 0.1455 π planes. b Constant energy ARPES image obtained by integrating the spectral weight within EF ± 10 meV recorded with 65 eV photons. Cuts 1 and 2 indicate the momentum locations of the experimental band structures in d–i. Red lines represent the (001) surface BZs. Red arrows indicate the triangle-shaped FSs centered at points in c. The intensity within the cyan dashed rectangle has been multiplied by 10. c Projections of calculated bulk FSs on the (001) surface. White lines represent the (001) surface BZs. d, e ARPES intensity plot and corresponding momentum distribution curves along the direction [cut 1 in b], respectively. Red and black dashed curves illuminate the electron bands forming the triangle-shaped FSs centered at points. f Projections of calculated bulk bands along the direction. g ARPES intensity plot along the direction [cut 2 in b]. Black curves represent the calculated bulk bands along the four directions indicated by blue lines in a, where the bands from bottom to top correspond to the cuts from top to bottom, respectively. h, i Second derivative intensity plots along cuts 3 and 4 recorded at hν = 135 and 128 eV (kz = ± 0.1455 π), respectively, with corresponding bulk calculations (superimposed red curves). The band crossings for WPs are highlighted by black curves. The crossing-EF features of the α1 bands are marked out by white dashed ellipses

