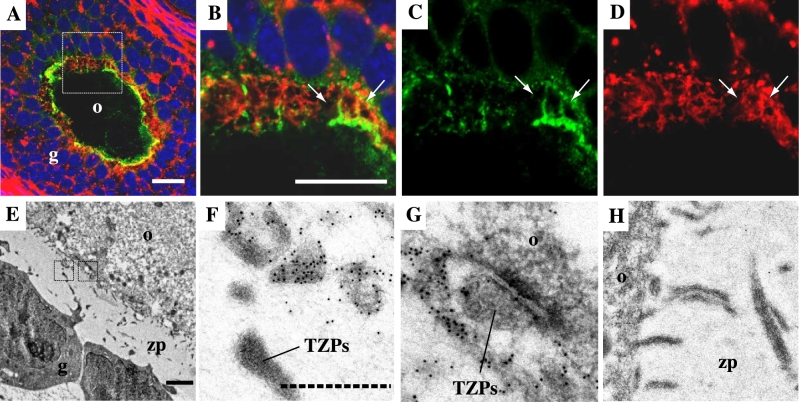
Figure 3.
Localization of AcGFP1 in CCOCs and TZPs. (A–D) Immunohistochemistry images. Anti-GFP antibody (green), phalloidin (red), and DAPI (blue). (B, C, D) Elongated images of the square area in (A). Arrows indicate AcGFP1-positive CCOCs. (E–H) Immunoelectron microscope images between an oocyte and granulosa cells. Black dots denote the signal of anti-GFP antibody. (F, G) Enlarged images of the area enclosed by a square in (E), respectively. (H) Negative control stained rabbit IgG. Notes: o, oocyte. g, granulosa cell. zp, zona pellucida. TZPs, transzonal projections. The white scale bar in (A) and (B): 20 μm; the black line in (E): 1 μm; the dashed line in (F): 200 nm.

