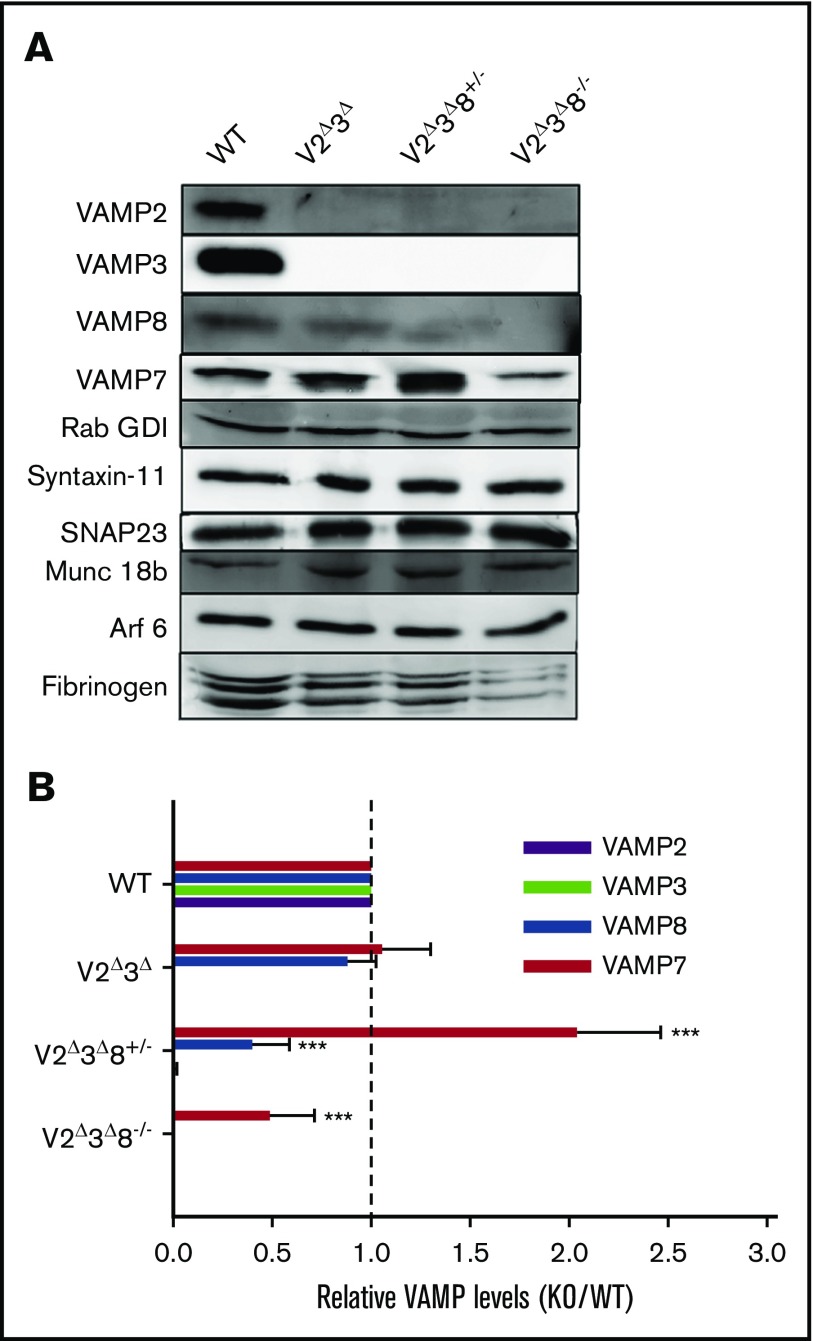
Figure 1.
Generation of V2Δ3Δand V2Δ3Δ8−/−animals. (A) A collage of representative western blots comparing protein levels among V2Δ3Δ, V2Δ3Δ8+/−, and V2Δ3Δ8−/− platelets. Washed platelets (5 × 10⁷ platelets per lane) were prepared from WT, V2Δ3Δ, V2Δ3Δ8+/−, and V2Δ3Δ8−/− mice, and the indicated proteins were probed for. The blots for VAMP7, VAMP8, and Rab GDI were from the same membrane. (B) The VAMP isoforms in V2Δ3Δ, V2Δ3Δ8+/−, and V2Δ3Δ8−/− platelets were quantified using Rab GDI as a loading control and ImageQuant TL software (v 7.0). The data were plotted as the ratio of knockout/WT. The vertical dashed line indicates a ratio of 1. Data are representative of platelets collected from individual mice from each strain and ≥3 independent experiments (see supplemental Figure 1 for additional blots for VAMP7 and VAMP8). A Student t test was used to analyze the data. ***P < .001.

