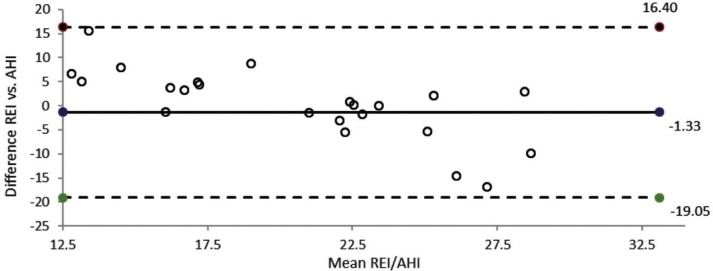
Figure 2. Bland-Altman plot: HSAT-derived REI and PSG-derived AHI in different nights.
The solid horizontal line represents the mean difference, and the dotted lines represent the 95% limits of agreement between the two measurements. The mean difference between the REI and the AHI is −1.33 units. AHI = apnea-hypopnea index, HSAT = home sleep apnea test, PSG = polysomnography, REI = respiratory event index.

