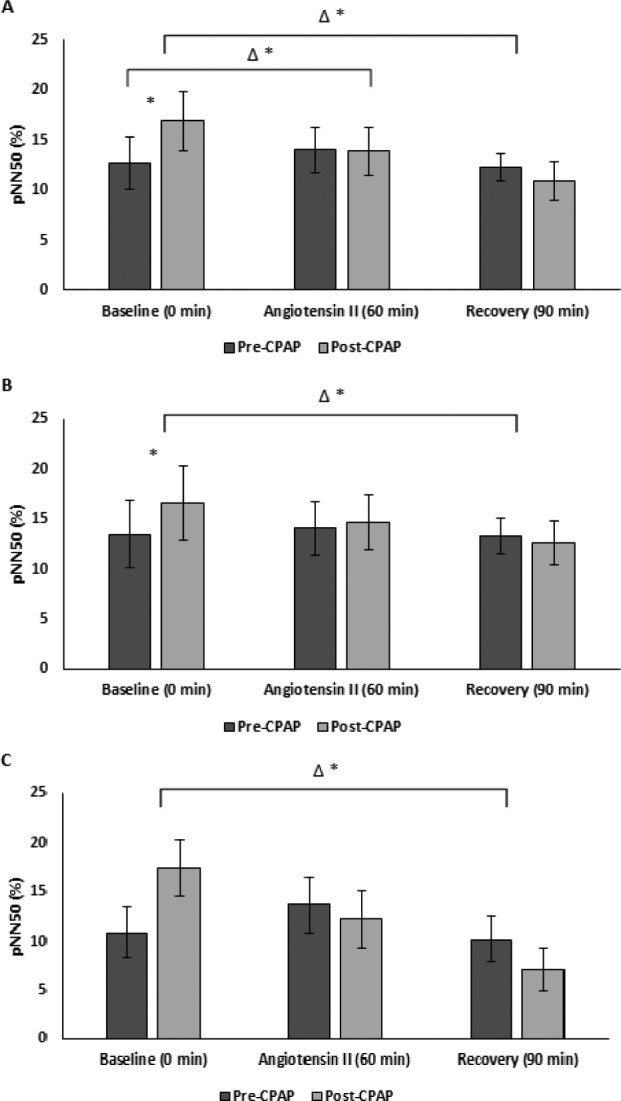
Figure 3. pNN50 pre-CPAP versus post-CPAP.

(A) All (B) male, and (C) female subjects. * = P < .05 versus pre-CPAP, Δ = change, CPAP = continuous positive airway pressure, pNN50 = percentage of normal waves that differ 50 ms compared with the wave directly prior.
