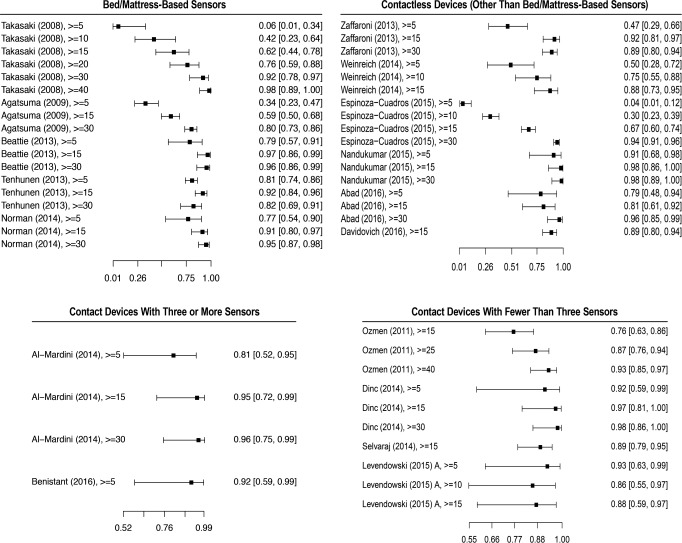
Figure 4. Forest plot of index tests specificity at different AHI thresholds.
Specificity and confidence intervals of all studies that provided false positive, false negative, true positive, and true negative in each group category. All AHI thresholds tested in the respective studies, including AHI thresholds not included in the meta-analysis are shown (AHI > 10, 25, 40 events/h). AHI = apnea-hypopnea index.

