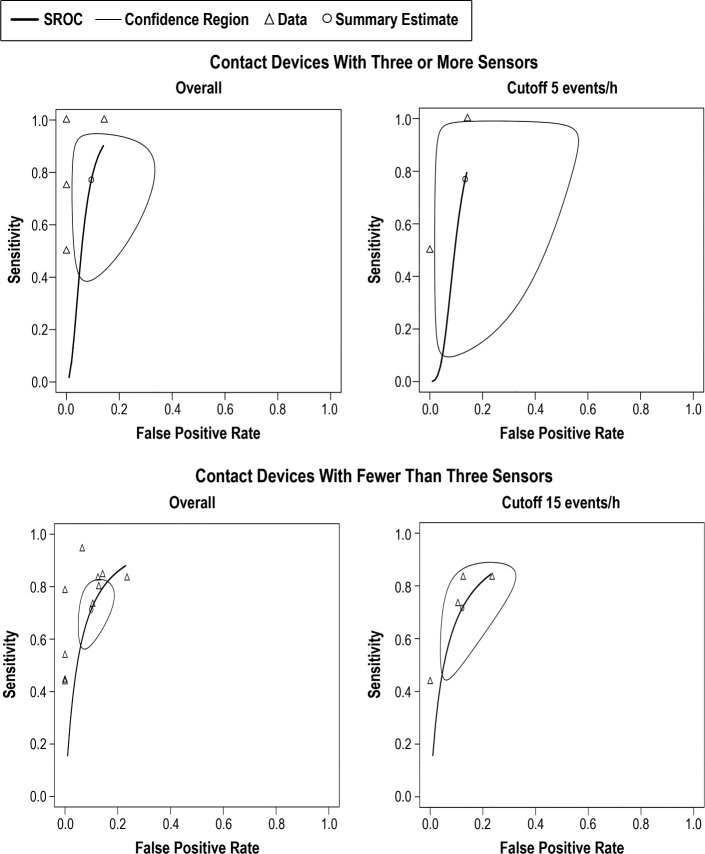
Figure 6. SROC curves for contact devices with three or more sensors overall and at AHI cutoff 5 events/h and contact devices with fewer than three sensors overall and at AHI cutoff 15 events/h.
Pooled results of the sensitivity and false positive results of the contact devices with three or more sensors and fewer than sensors are shown. Not all studies are included in each AHI threshold shown, and the number of studies included depended on the information available by the authors. AHI = apneahypopnea index, SROC = summary receiver operating characteristic.

