
Figure 1.
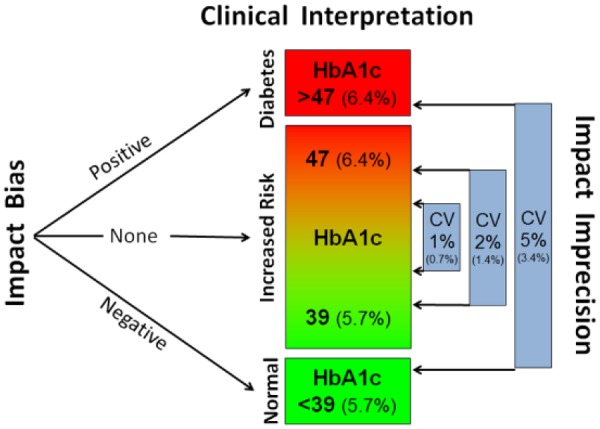
Impact of bias and imprecision on the clinical interpretation of a sample with an HbA1c of 43 mmol/mol (6.1%). HbA1c in IFCC/SI units (NGSP/DCCT units in brackets). The impact of a bias of 5 mmol/mol (0.46%) is shown on the left. The impact of several levels of imprecision is shown on the right. For details see the text.