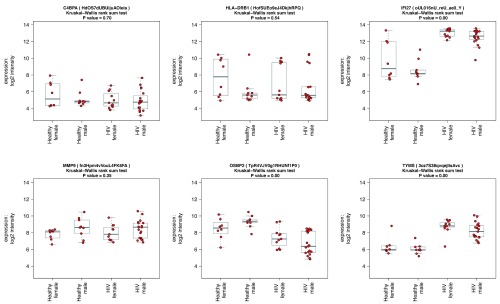
Figure 3. Visualising individual probe-level expression data.
Box-and-whisker plots showing normalized, log 2-transformed probe-level expression data for six selected genes, obtained by a custom function in R in four groups: Healthy female, N = 8, Healthy male, N = 9, acute HIV female, N = 11, acute HIV male, N = 19; data from HIVsetB dataset. Gene (and probe nuIDs for disambiguation) are given for reference; the y-axis shows log2 scale normalized intensity values. Box and whisker plots show median, interquartile range, and range. Outliers are defined as values that lie beyond the whiskers, which extend to maximally 1.5 X the length of the box. Individual datapoints are superimposed in red on the box-and-whisker plots. The four groups are compared using Kruskal Wallis rank sum test, and the P-value for the comparison is shown in the plot title. Results for individual pairwise comparisons are not shown.

