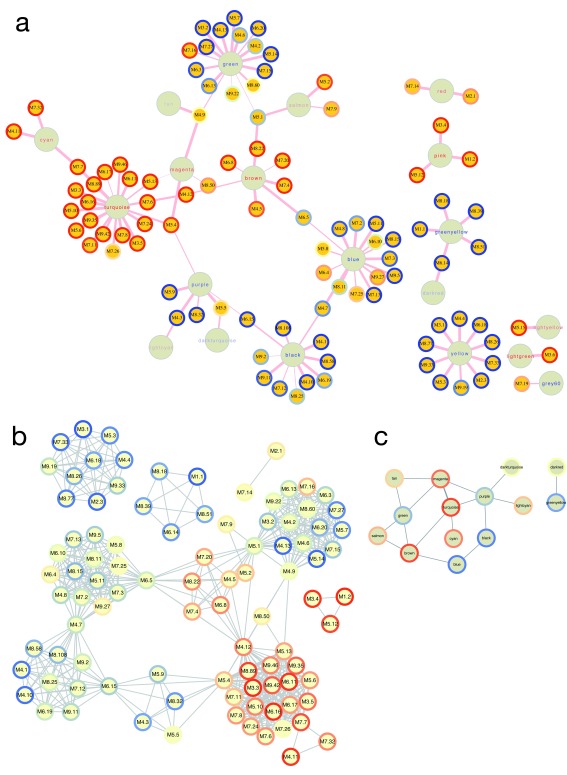
Figure 7. Relationships between WGCNA and Chaussabel modules.
( A) Bipartite graph of the two module types based on the hypergeometric association index in the HIVsetA dataset (acute HIV, N = 28 vs healthy controls, N = 23). Strikingly, Chaussabel modules tend to have the same direction of differential expression (indicated by the rim colour of the Chaussabel modules, red indicating up-regulation in acute HIV, and blue indicating downregulation) as WGCNA modules they map to, indicated by the label colour of the module. ( B) Projection 1 of ( A), showing relationships between Chaussabel modules based on shared WGCNA modules; dense cliques of modules are observed. ( C) Projection 2 of ( A), showing relationships between WGCNA modules based on shared Chaussabel modules. All associations (hypergeometric test) shown are corrected for multiple testing, BH-corrected P-value < 0.05. All outputs were generated using the igraph_plotter function, exporting vertex and edge tables of the bipartite graph and the two projections and importing these into Cytoscape.

