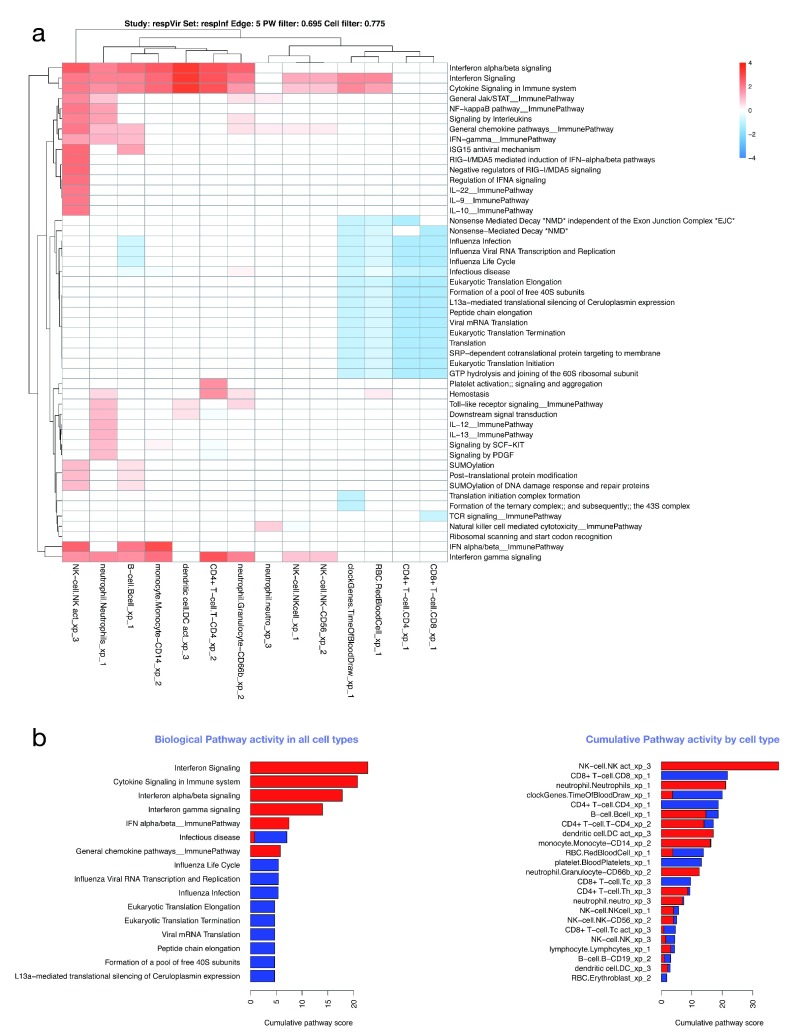
Figure 8. Cell/pathway activity matrix.
( A) Cell/pathway activity matrix for all cell-types for the respInf dataset (Day 0 acute influenza, N = 46 vs baseline healthy samples, N = 48, see Figure S1). The clustered heatmap shows pathway activity scores representing the mean log-2 fold change for all probes in the pathway for a particular cell type (see Supplementary methods). There is a clear interferon response in multiple cell types, as well as down-regulation of other pathways associated with translation. ( B) Barplots highlighting the most highly differentially regulated pathways (left panel, determined by row sums of matrix in A), and cells with highest levels of differential expression (right panel, determined by column sums of matrix in A). In all cases, up- and downregulated pathway scores are kept separate.

