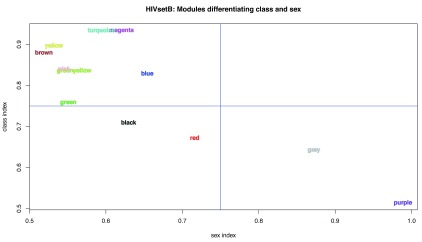
Figure 9. WGCNA module indices.
Plot of module indices representing the area-under-the-ROC curve for the two classes for all WGCNA modules in the HIVsetB dataset (N HIV=30, N Controls=17, see Figure S1; Supplementary File 1). The indices are named per the variable they aim to differentiate (disease class or sex). The class index corresponds to the modAUC1 variable and the sex index corresponds to modAUC2. These indices are calculated form the module eigengenes and given class assignments using functions from the rocr package. See text and Supplementary methods for details.

