
FIG. 2.
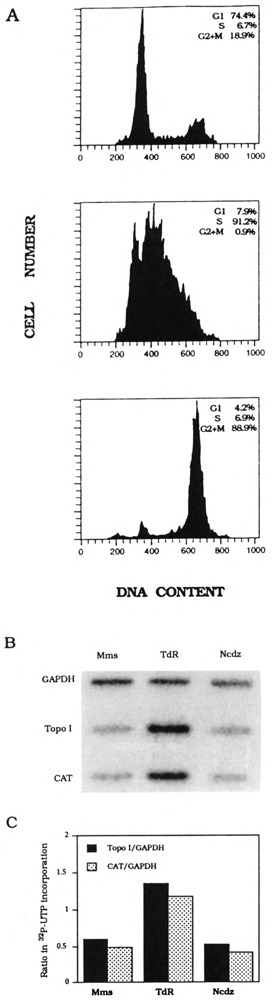
K562 DNA topoisomerase I-CAT stable transfectant cell cycle synchronization and transcription analysis. (A) Flow cytometry analysis of mimosine-arrested cells (top), thymidine-blocked cells (middle), and nocodazole-inhibited cells (bottom). The distribution of DNA contents was determined by FACScan. Percentage of G1 S-phase, and G2 × M cells in each synchronized cell fraction is shown in each inset. (B) Hybridization of nascent nuclear transcripts from mimosine-arrested (Mms), thymidine-blocked (TdR), or nocodazole-inhibited (Ncdz) cells to DNA topoisomerase I, CAT, and GAPDH DNA probes. (C) Quantitation of nascent DNA topoisomerase I and CAT transcripts normalized with nascent GAPDH transcripts, respectively, in mimosine-arrested (Mms), thymidine-blocked (TdR), or nocodazole inhibited (Ncdz) cells.