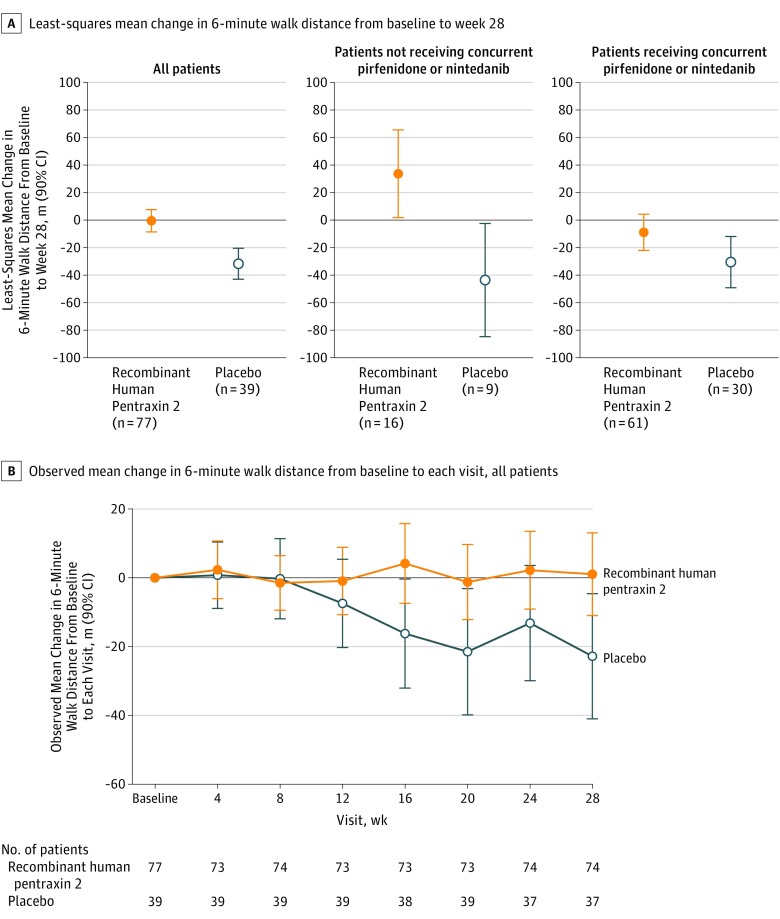
Figure 3. Least-Squares Mean Change (Secondary End Point) and Observed Mean Change in 6-Minute Walk Distance From Baseline to Week 28.
For panel A, the between-group difference was 31.3 (90% CI, 17.4 to 45.1; P<.001) for all patients, 77.2 (90% CI, 25.2 to 129.3; P = .02) for patients not receiving concurrent pirfenidone or nintedanib, and 21.6 (90% CI, −1.2 to 44.4; P = .12) for patients receiving concurrent pirfenidone or nintedanib.

