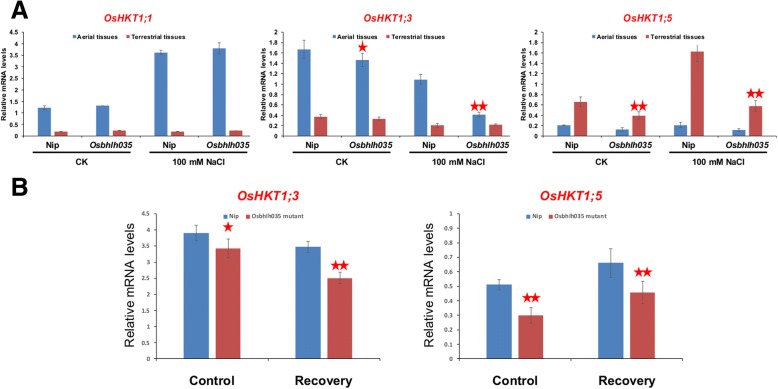
Fig. 7.
Effects of salinity on the OsHKT1s expression profile in both WT and Osbhlh035 seedlings. a Quantification of OsHKT1;1, OsHKT1;3, and OsHKT1;5 mRNAs in aerial and terrestrial tissues from both salt-treated WT and Osbhlh035 seedlings. b Quantification of OsHKT1;3 and OsHKT1;5 mRNAs in aerial (left panel) and terrestrial (right panel) tissues, respectively, from both salt-relieved WT and Osbhlh035 seedlings. The seedlings were grown on basal medium for 11 days and then transferred to basal medium containing 0 (CK) or 100 mM NaCl (salt-treated conditions) for an additional 3 days. After day 14, the seedlings were returned to basal medium for 7 days (Recovery). Asterisks indicate significant differences in comparison to WT (*P < 0.05 and **P < 0.01) based on Student’s t-test

