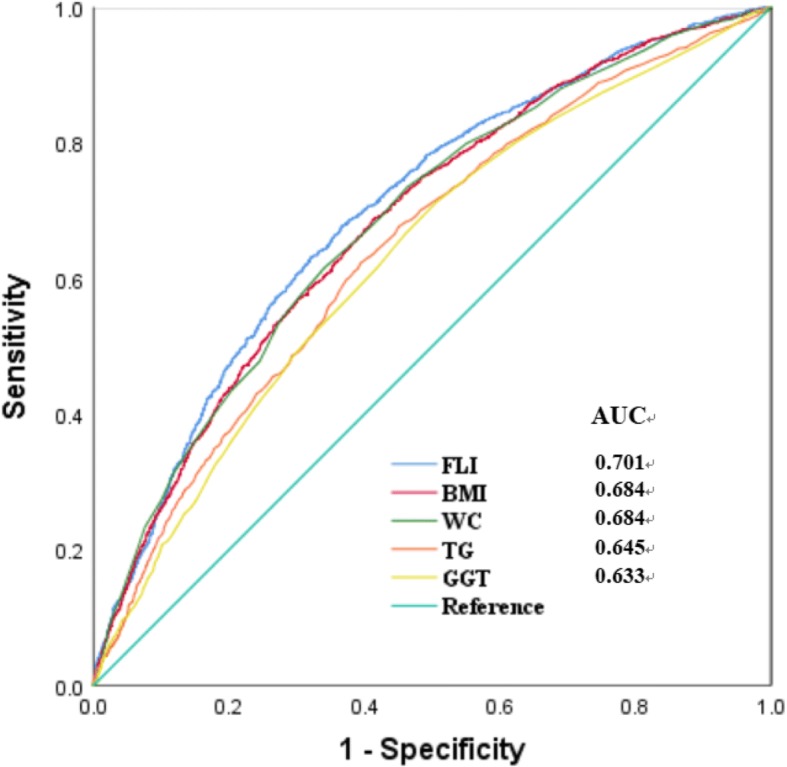
Fig. 2.

Receiver operative characteristic (ROC) curves and corresponding areas under the curve (AUC) for HTN. The AUC of FLI, TG, GGT, WC and BMI were 0.701 (95% CI 0.686–0.716), 0.645 (95% CI 0.629–0.661), 0.633 (95% CI 0.617–0.649), 0.684 (95% CI 0.669–0.699) and 0.684 (95% CI 0.669–0.699), respectively. p values for the difference between FLI and other two AUCs were < 0.01
