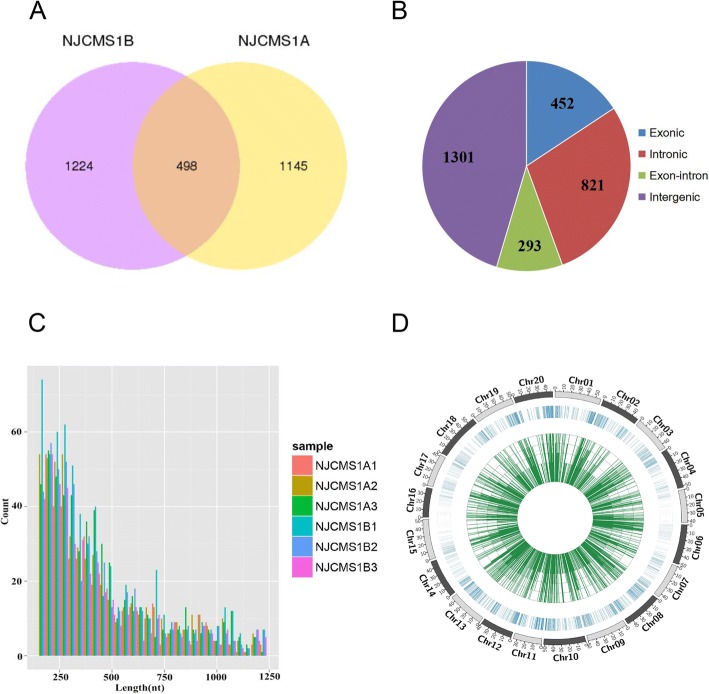
Fig. 1.
CircRNA sequencing data. (a) Venn diagram shows the number of the identified circRNAs in NJCMS1A and NJCMS1B. (b) Source statistics of the circRNAs. (c) Sequence length distribution of the circRNAs in different samples. (d) Circle plot shows the distribution of the identified circRNAs in soybean chromosomes and their expression levels. The outermost layer represents all soybean chromosomes (Chr01-Chr20). The middle blue lines show the distribution of the circRNAs in soybean chromosomes, while the denser lines indicate more circRNA distribution. The innermost green lines show expression levels of the circRNAs, and the height of the lines indicates the level of expression

