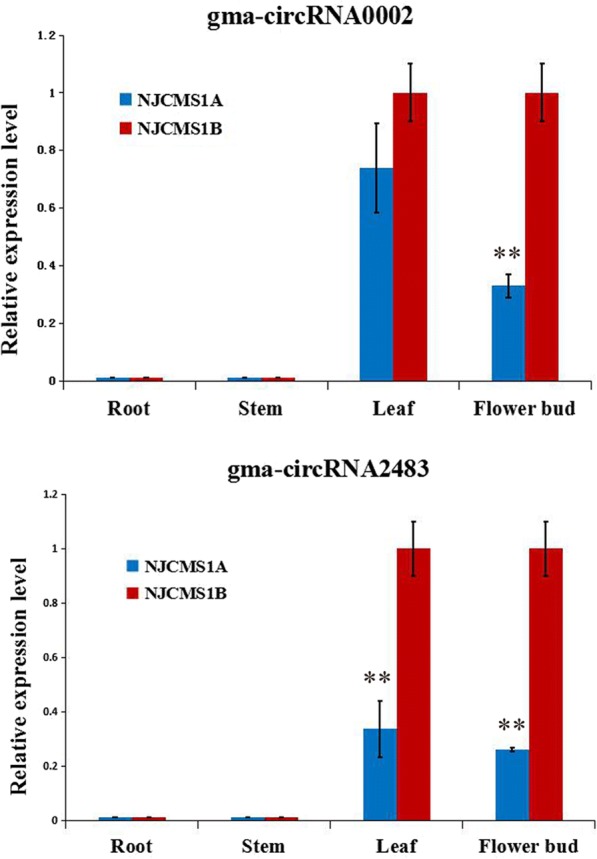
Fig. 4.

Tissue specific expression patterns validation by qRT-PCR. The relative expression levels of gma-circRNA0002 and gma-circRNA2483 were obtained from roots, stems, leaves and flower buds with three biological replicates by qRT-PCR,, and the error bars indicated the standard error of the mean of 2–ΔΔCt, with NJCMS1B as a control. The sign “**” represents P < 0.01 according to student t-test, which indicated extremely significantly differences between NJCMS1A and NJCMS1B
