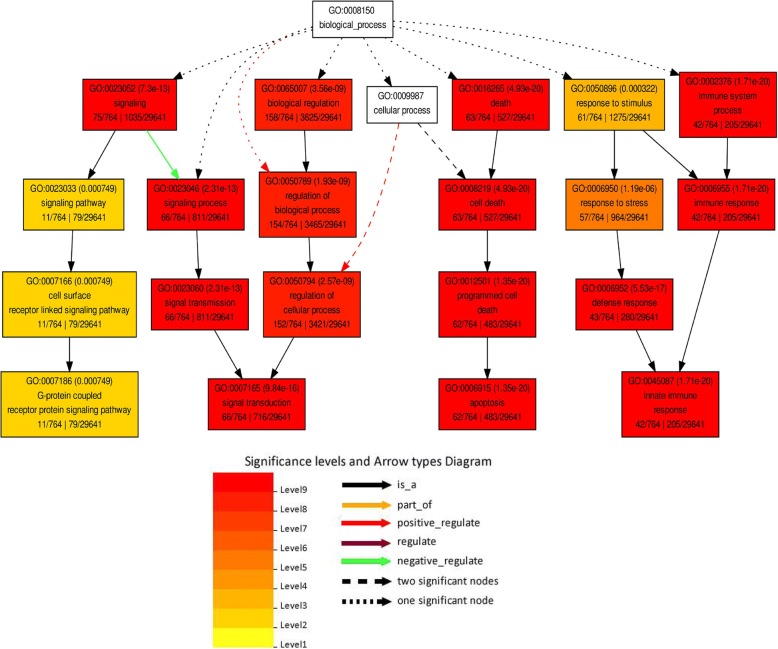
Fig. 7.
A direct acyclic graph (DAG) illustrating the biological process category generated from the Gene Ontology (GO) annotation of the predicted target miRNAs. The nodes in the image are classified into ten levels, which are associated with corresponding specific colors. The smaller of the term’s adjusted p-value, the more significant statistically, and the node’s color is darker and redder. Inside the box of the significant terms, the information include: GO term, adjusted p-value, GO description, item number mapping the GO in the query list and background, and total number of the query list and background. Different arrow types are also shown in the annotation diagram

